LinearNDInterpolator — SciPy v1.16.0 Manual (original) (raw)
scipy.interpolate.
class scipy.interpolate.LinearNDInterpolator(points, values, fill_value=np.nan, rescale=False)#
Piecewise linear interpolator in N > 1 dimensions.
Added in version 0.9.
Parameters:
pointsndarray of floats, shape (npoints, ndims); or Delaunay
2-D array of data point coordinates, or a precomputed Delaunay triangulation.
valuesndarray of float or complex, shape (npoints, …), optional
N-D array of data values at points. The length of values along the first axis must be equal to the length of points. Unlike some interpolators, the interpolation axis cannot be changed.
fill_valuefloat, optional
Value used to fill in for requested points outside of the convex hull of the input points. If not provided, then the default is nan.
rescalebool, optional
Rescale points to unit cube before performing interpolation. This is useful if some of the input dimensions have incommensurable units and differ by many orders of magnitude.
Methods
Notes
The interpolant is constructed by triangulating the input data with Qhull [1], and on each triangle performing linear barycentric interpolation.
Note
For data on a regular grid use interpn instead.
References
Examples
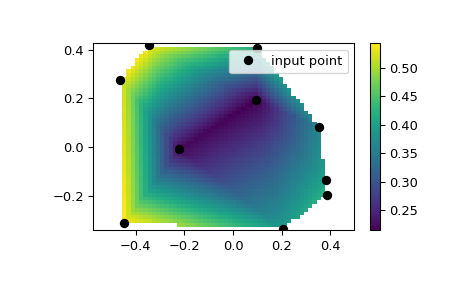
We can interpolate values on a 2D plane:
from scipy.interpolate import LinearNDInterpolator import numpy as np import matplotlib.pyplot as plt rng = np.random.default_rng() x = rng.random(10) - 0.5 y = rng.random(10) - 0.5 z = np.hypot(x, y) X = np.linspace(min(x), max(x)) Y = np.linspace(min(y), max(y)) X, Y = np.meshgrid(X, Y) # 2D grid for interpolation interp = LinearNDInterpolator(list(zip(x, y)), z) Z = interp(X, Y) plt.pcolormesh(X, Y, Z, shading='auto') plt.plot(x, y, "ok", label="input point") plt.legend() plt.colorbar() plt.axis("equal") plt.show()