interp1d — SciPy v1.16.0 Manual (original) (raw)
scipy.interpolate.
class scipy.interpolate.interp1d(x, y, kind='linear', axis=-1, copy=True, bounds_error=None, fill_value=nan, assume_sorted=False)[source]#
Interpolate a 1-D function (legacy).
Legacy
This class is considered legacy and will no longer receive updates. While we currently have no plans to remove it, we recommend that new code uses more modern alternatives instead. For a guide to the intended replacements for interp1d see1-D interpolation.
x and y are arrays of values used to approximate some function f:y = f(x). This class returns a function whose call method uses interpolation to find the value of new points.
Parameters:
x(npoints, ) array_like
A 1-D array of real values.
y(…, npoints, …) array_like
A N-D array of real values. The length of y along the interpolation axis must be equal to the length of x. Use the axis parameter to select correct axis. Unlike other interpolators, the default interpolation axis is the last axis of y.
kindstr or int, optional
Specifies the kind of interpolation as a string or as an integer specifying the order of the spline interpolator to use. The string has to be one of ‘linear’, ‘nearest’, ‘nearest-up’, ‘zero’, ‘slinear’, ‘quadratic’, ‘cubic’, ‘previous’, or ‘next’. ‘zero’, ‘slinear’, ‘quadratic’ and ‘cubic’ refer to a spline interpolation of zeroth, first, second or third order; ‘previous’ and ‘next’ simply return the previous or next value of the point; ‘nearest-up’ and ‘nearest’ differ when interpolating half-integers (e.g. 0.5, 1.5) in that ‘nearest-up’ rounds up and ‘nearest’ rounds down. Default is ‘linear’.
axisint, optional
Axis in the y array corresponding to the x-coordinate values. Unlike other interpolators, defaults to axis=-1.
copybool, optional
If True, the class makes internal copies of x and y. If False, references to x and y are used if possible. The default is to copy.
bounds_errorbool, optional
If True, a ValueError is raised any time interpolation is attempted on a value outside of the range of x (where extrapolation is necessary). If False, out of bounds values are assigned fill_value. By default, an error is raised unless fill_value="extrapolate".
fill_valuearray-like or (array-like, array_like) or “extrapolate”, optional
- if a ndarray (or float), this value will be used to fill in for requested points outside of the data range. If not provided, then the default is NaN. The array-like must broadcast properly to the dimensions of the non-interpolation axes.
- If a two-element tuple, then the first element is used as a fill value for
x_new < x[0]and the second element is used forx_new > x[-1]. Anything that is not a 2-element tuple (e.g., list or ndarray, regardless of shape) is taken to be a single array-like argument meant to be used for both bounds asbelow, above = fill_value, fill_value. Using a two-element tuple or ndarray requiresbounds_error=False.
Added in version 0.17.0. - If “extrapolate”, then points outside the data range will be extrapolated.
Added in version 0.17.0.
assume_sortedbool, optional
If False, values of x can be in any order and they are sorted first. If True, x has to be an array of monotonically increasing values.
Attributes:
The fill value.
Methods
Notes
Calling interp1d with NaNs present in input values results in undefined behaviour.
Input values x and y must be convertible to float values like_int_ or float.
If the values in x are not unique, the resulting behavior is undefined and specific to the choice of kind, i.e., changing_kind_ will change the behavior for duplicates.
Examples
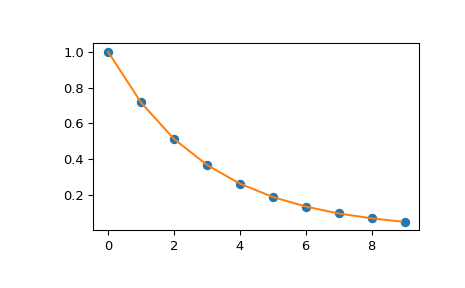
import numpy as np import matplotlib.pyplot as plt from scipy import interpolate x = np.arange(0, 10) y = np.exp(-x/3.0) f = interpolate.interp1d(x, y)
xnew = np.arange(0, 9, 0.1) ynew = f(xnew) # use interpolation function returned by
interp1dplt.plot(x, y, 'o', xnew, ynew, '-') plt.show()