correlate2d — SciPy v1.15.2 Manual (original) (raw)
scipy.signal.
scipy.signal.correlate2d(in1, in2, mode='full', boundary='fill', fillvalue=0)[source]#
Cross-correlate two 2-dimensional arrays.
Cross correlate in1 and in2 with output size determined by mode, and boundary conditions determined by boundary and fillvalue.
Parameters:
in1array_like
First input.
in2array_like
Second input. Should have the same number of dimensions as in1.
modestr {‘full’, ‘valid’, ‘same’}, optional
A string indicating the size of the output:
full
The output is the full discrete linear cross-correlation of the inputs. (Default)
valid
The output consists only of those elements that do not rely on the zero-padding. In ‘valid’ mode, either in1 or _in2_must be at least as large as the other in every dimension.
same
The output is the same size as in1, centered with respect to the ‘full’ output.
boundarystr {‘fill’, ‘wrap’, ‘symm’}, optional
A flag indicating how to handle boundaries:
fill
pad input arrays with fillvalue. (default)
wrap
circular boundary conditions.
symm
symmetrical boundary conditions.
fillvaluescalar, optional
Value to fill pad input arrays with. Default is 0.
Returns:
correlate2dndarray
A 2-dimensional array containing a subset of the discrete linear cross-correlation of in1 with in2.
Notes
When using “same” mode with even-length inputs, the outputs of correlateand correlate2d differ: There is a 1-index offset between them.
Examples
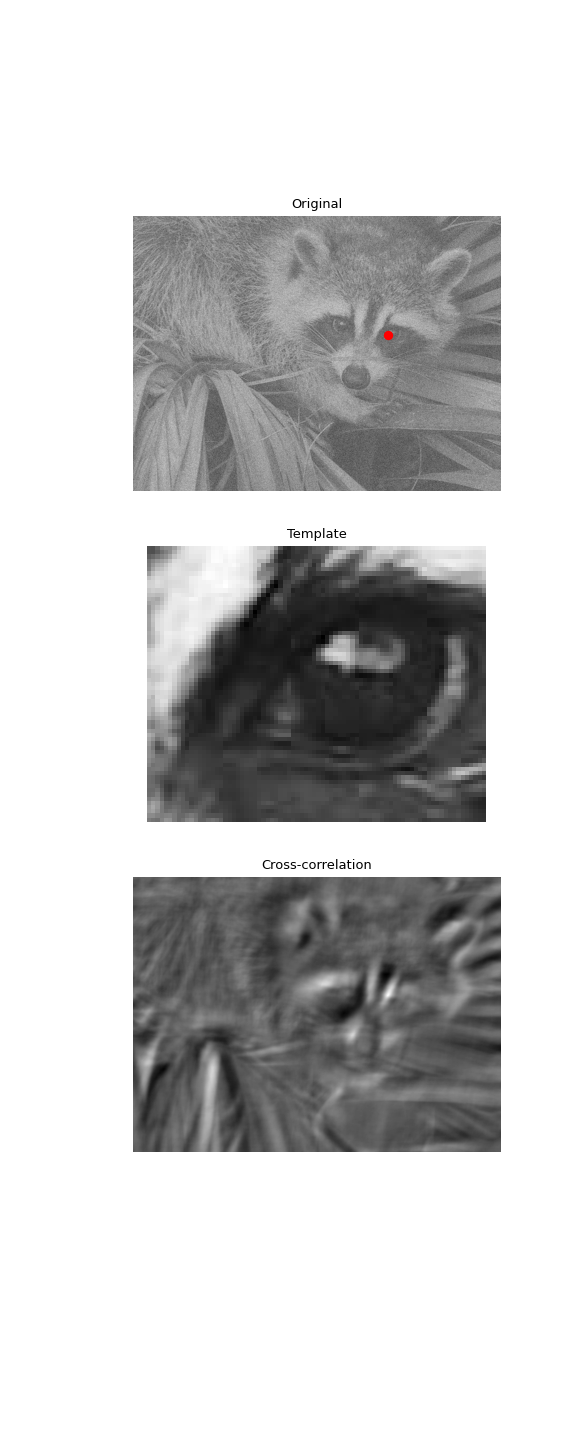
Use 2D cross-correlation to find the location of a template in a noisy image:
import numpy as np from scipy import signal, datasets, ndimage rng = np.random.default_rng() face = datasets.face(gray=True) - datasets.face(gray=True).mean() face = ndimage.zoom(face[30:500, 400:950], 0.5) # extract the face template = np.copy(face[135:165, 140:175]) # right eye template -= template.mean() face = face + rng.standard_normal(face.shape) * 50 # add noise corr = signal.correlate2d(face, template, boundary='symm', mode='same') y, x = np.unravel_index(np.argmax(corr), corr.shape) # find the match
import matplotlib.pyplot as plt fig, (ax_orig, ax_template, ax_corr) = plt.subplots(3, 1, ... figsize=(6, 15)) ax_orig.imshow(face, cmap='gray') ax_orig.set_title('Original') ax_orig.set_axis_off() ax_template.imshow(template, cmap='gray') ax_template.set_title('Template') ax_template.set_axis_off() ax_corr.imshow(corr, cmap='gray') ax_corr.set_title('Cross-correlation') ax_corr.set_axis_off() ax_orig.plot(x, y, 'ro') fig.show()