firls — SciPy v1.15.3 Manual (original) (raw)
scipy.signal.
scipy.signal.firls(numtaps, bands, desired, *, weight=None, fs=None)[source]#
FIR filter design using least-squares error minimization.
Calculate the filter coefficients for the linear-phase finite impulse response (FIR) filter which has the best approximation to the desired frequency response described by bands and_desired_ in the least squares sense (i.e., the integral of the weighted mean-squared error within the specified bands is minimized).
Parameters:
numtapsint
The number of taps in the FIR filter. numtaps must be odd.
bandsarray_like
A monotonic nondecreasing sequence containing the band edges in Hz. All elements must be non-negative and less than or equal to the Nyquist frequency given by nyq. The bands are specified as frequency pairs, thus, if using a 1D array, its length must be even, e.g., np.array([0, 1, 2, 3, 4, 5]). Alternatively, the bands can be specified as an nx2 sized 2D array, where n is the number of bands, e.g, np.array([[0, 1], [2, 3], [4, 5]]).
desiredarray_like
A sequence the same size as bands containing the desired gain at the start and end point of each band.
weightarray_like, optional
A relative weighting to give to each band region when solving the least squares problem. weight has to be half the size of_bands_.
fsfloat, optional
The sampling frequency of the signal. Each frequency in _bands_must be between 0 and fs/2 (inclusive). Default is 2.
Returns:
coeffsndarray
Coefficients of the optimal (in a least squares sense) FIR filter.
Notes
This implementation follows the algorithm given in [1]. As noted there, least squares design has multiple advantages:
- Optimal in a least-squares sense.
- Simple, non-iterative method.
- The general solution can obtained by solving a linear system of equations.
- Allows the use of a frequency dependent weighting function.
This function constructs a Type I linear phase FIR filter, which contains an odd number of coeffs satisfying for \(n < numtaps\):
\[coeffs(n) = coeffs(numtaps - 1 - n)\]
The odd number of coefficients and filter symmetry avoid boundary conditions that could otherwise occur at the Nyquist and 0 frequencies (e.g., for Type II, III, or IV variants).
Added in version 0.18.
References
Examples
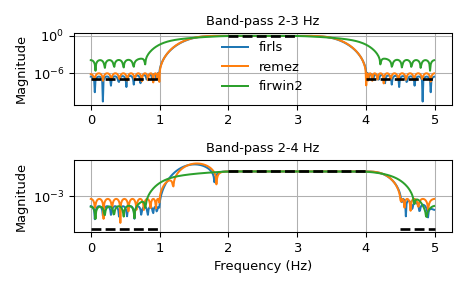
We want to construct a band-pass filter. Note that the behavior in the frequency ranges between our stop bands and pass bands is unspecified, and thus may overshoot depending on the parameters of our filter:
import numpy as np from scipy import signal import matplotlib.pyplot as plt fig, axs = plt.subplots(2) fs = 10.0 # Hz desired = (0, 0, 1, 1, 0, 0) for bi, bands in enumerate(((0, 1, 2, 3, 4, 5), (0, 1, 2, 4, 4.5, 5))): ... fir_firls = signal.firls(73, bands, desired, fs=fs) ... fir_remez = signal.remez(73, bands, desired[::2], fs=fs) ... fir_firwin2 = signal.firwin2(73, bands, desired, fs=fs) ... hs = list() ... ax = axs[bi] ... for fir in (fir_firls, fir_remez, fir_firwin2): ... freq, response = signal.freqz(fir) ... hs.append(ax.semilogy(0.5fsfreq/np.pi, np.abs(response))[0]) ... for band, gains in zip(zip(bands[::2], bands[1::2]), ... zip(desired[::2], desired[1::2])): ... ax.semilogy(band, np.maximum(gains, 1e-7), 'k--', linewidth=2) ... if bi == 0: ... ax.legend(hs, ('firls', 'remez', 'firwin2'), ... loc='lower center', frameon=False) ... else: ... ax.set_xlabel('Frequency (Hz)') ... ax.grid(True) ... ax.set(title='Band-pass %d-%d Hz' % bands[2:4], ylabel='Magnitude') ... fig.tight_layout() plt.show()