lp2bp — SciPy v1.15.3 Manual (original) (raw)
scipy.signal.
scipy.signal.lp2bp(b, a, wo=1.0, bw=1.0)[source]#
Transform a lowpass filter prototype to a bandpass filter.
Return an analog band-pass filter with center frequency wo and bandwidth bw from an analog low-pass filter prototype with unity cutoff frequency, in transfer function (‘ba’) representation.
Parameters:
barray_like
Numerator polynomial coefficients.
aarray_like
Denominator polynomial coefficients.
wofloat
Desired passband center, as angular frequency (e.g., rad/s). Defaults to no change.
bwfloat
Desired passband width, as angular frequency (e.g., rad/s). Defaults to 1.
Returns:
barray_like
Numerator polynomial coefficients of the transformed band-pass filter.
aarray_like
Denominator polynomial coefficients of the transformed band-pass filter.
Notes
This is derived from the s-plane substitution
\[s \rightarrow \frac{s^2 + {\omega_0}^2}{s \cdot \mathrm{BW}}\]
This is the “wideband” transformation, producing a passband with geometric (log frequency) symmetry about wo.
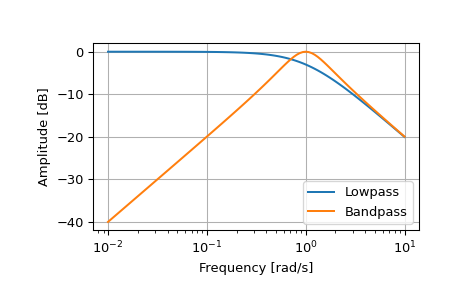
Examples
from scipy import signal import matplotlib.pyplot as plt
lp = signal.lti([1.0], [1.0, 1.0]) bp = signal.lti(*signal.lp2bp(lp.num, lp.den)) w, mag_lp, p_lp = lp.bode() w, mag_bp, p_bp = bp.bode(w)
plt.plot(w, mag_lp, label='Lowpass') plt.plot(w, mag_bp, label='Bandpass') plt.semilogx() plt.grid(True) plt.xlabel('Frequency [rad/s]') plt.ylabel('Amplitude [dB]') plt.legend()