scipy.special.modstruve — SciPy v1.15.3 Manual (original) (raw)
scipy.special.modstruve(v, x, out=None) = <ufunc 'modstruve'>#
Modified Struve function.
Return the value of the modified Struve function of order v at x. The modified Struve function is defined as,
\[L_v(x) = -\imath \exp(-\pi\imath v/2) H_v(\imath x),\]
where \(H_v\) is the Struve function.
Parameters:
varray_like
Order of the modified Struve function (float).
xarray_like
Argument of the Struve function (float; must be positive unless v is an integer).
outndarray, optional
Optional output array for the function results
Returns:
Lscalar or ndarray
Value of the modified Struve function of order v at x.
Notes
Three methods discussed in [1] are used to evaluate the function:
- power series
- expansion in Bessel functions (if \(|x| < |v| + 20\))
- asymptotic large-x expansion (if \(x \geq 0.7v + 12\))
Rounding errors are estimated based on the largest terms in the sums, and the result associated with the smallest error is returned.
References
Examples
Calculate the modified Struve function of order 1 at 2.
import numpy as np from scipy.special import modstruve import matplotlib.pyplot as plt modstruve(1, 2.) 1.102759787367716
Calculate the modified Struve function at 2 for orders 1, 2 and 3 by providing a list for the order parameter v.
modstruve([1, 2, 3], 2.) array([1.10275979, 0.41026079, 0.11247294])
Calculate the modified Struve function of order 1 for several points by providing an array for x.
points = np.array([2., 5., 8.]) modstruve(1, points) array([ 1.10275979, 23.72821578, 399.24709139])
Compute the modified Struve function for several orders at several points by providing arrays for v and z. The arrays have to be broadcastable to the correct shapes.
orders = np.array([[1], [2], [3]]) points.shape, orders.shape ((3,), (3, 1))
modstruve(orders, points) array([[1.10275979e+00, 2.37282158e+01, 3.99247091e+02], [4.10260789e-01, 1.65535979e+01, 3.25973609e+02], [1.12472937e-01, 9.42430454e+00, 2.33544042e+02]])
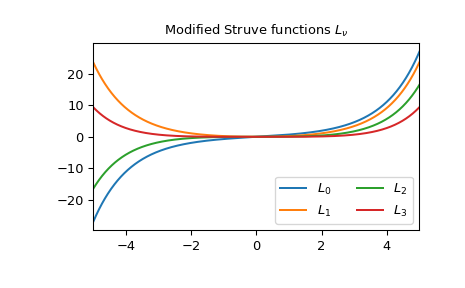
Plot the modified Struve functions of order 0 to 3 from -5 to 5.
fig, ax = plt.subplots() x = np.linspace(-5., 5., 1000) for i in range(4): ... ax.plot(x, modstruve(i, x), label=f'$L_{i!r}$') ax.legend(ncol=2) ax.set_xlim(-5, 5) ax.set_title(r"Modified Struve functions LνL_{\nu}Lν") plt.show()