scipy.special.nctdtr — SciPy v1.15.2 Manual (original) (raw)
scipy.special.nctdtr(df, nc, t, out=None) = <ufunc 'nctdtr'>#
Cumulative distribution function of the non-central t distribution.
Parameters:
dfarray_like
Degrees of freedom of the distribution. Should be in range (0, inf).
ncarray_like
Noncentrality parameter.
tarray_like
Quantiles, i.e., the upper limit of integration.
outndarray, optional
Optional output array for the function results
Returns:
cdfscalar or ndarray
The calculated CDF. If all inputs are scalar, the return will be a float. Otherwise, it will be an array.
See also
Inverse CDF (iCDF) of the non-central t distribution.
Calculate degrees of freedom, given CDF and iCDF values.
Calculate non-centrality parameter, given CDF iCDF values.
Notes
This function calculates the CDF of the non-central t distribution using the Boost Math C++ library [1].
Note that the argument order of nctdtr is different from that of the similar cdf method of scipy.stats.nct: t is the last parameter of nctdtr but the first parameter of scipy.stats.nct.cdf.
References
Examples
import numpy as np from scipy import special from scipy import stats import matplotlib.pyplot as plt
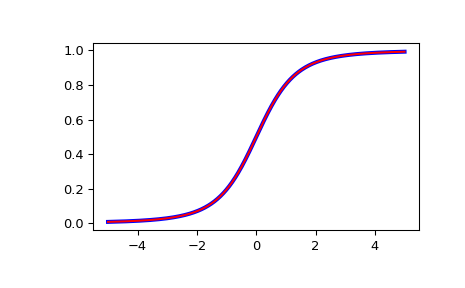
Plot the CDF of the non-central t distribution, for nc=0. Compare with the t-distribution from scipy.stats:
x = np.linspace(-5, 5, num=500) df = 3 nct_stats = stats.t.cdf(x, df) nct_special = special.nctdtr(df, 0, x)
fig = plt.figure() ax = fig.add_subplot(111) ax.plot(x, nct_stats, 'b-', lw=3) ax.plot(x, nct_special, 'r-') plt.show()