scipy.special.spence — SciPy v1.15.2 Manual (original) (raw)
scipy.special.spence(z, out=None) = <ufunc 'spence'>#
Spence’s function, also known as the dilogarithm.
It is defined to be
\[\int_1^z \frac{\log(t)}{1 - t}dt\]
for complex \(z\), where the contour of integration is taken to avoid the branch cut of the logarithm. Spence’s function is analytic everywhere except the negative real axis where it has a branch cut.
Parameters:
zarray_like
Points at which to evaluate Spence’s function
outndarray, optional
Optional output array for the function results
Returns:
sscalar or ndarray
Computed values of Spence’s function
Notes
There is a different convention which defines Spence’s function by the integral
\[-\int_0^z \frac{\log(1 - t)}{t}dt;\]
this is our spence(1 - z).
Examples
import numpy as np from scipy.special import spence import matplotlib.pyplot as plt
The function is defined for complex inputs:
spence([1-1j, 1.5+2j, 3j, -10-5j]) array([-0.20561676+0.91596559j, -0.86766909-1.39560134j, -0.59422064-2.49129918j, -1.14044398+6.80075924j])
For complex inputs on the branch cut, which is the negative real axis, the function returns the limit for z with positive imaginary part. For example, in the following, note the sign change of the imaginary part of the output for z = -2 and z = -2 - 1e-8j:
spence([-2 + 1e-8j, -2, -2 - 1e-8j]) array([2.32018041-3.45139229j, 2.32018042-3.4513923j , 2.32018041+3.45139229j])
The function returns nan for real inputs on the branch cut:
Verify some particular values: spence(0) = pi**2/6,spence(1) = 0 and spence(2) = -pi**2/12.
spence([0, 1, 2]) array([ 1.64493407, 0. , -0.82246703]) np.pi2/6, -np.pi2/12 (1.6449340668482264, -0.8224670334241132)
Verify the identity:
spence(z) + spence(1 - z) = pi**2/6 - log(z)*log(1 - z)
z = 3 + 4j spence(z) + spence(1 - z) (-2.6523186143876067+1.8853470951513935j) np.pi**2/6 - np.log(z)*np.log(1 - z) (-2.652318614387606+1.885347095151394j)
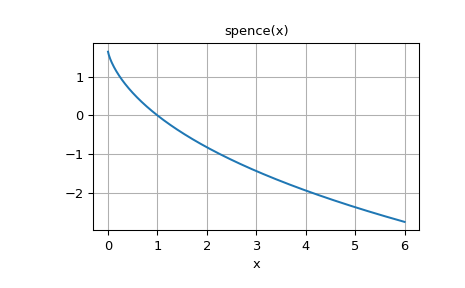
Plot the function for positive real input.
fig, ax = plt.subplots() x = np.linspace(0, 6, 400) ax.plot(x, spence(x)) ax.grid() ax.set_xlabel('x') ax.set_title('spence(x)') plt.show()