y1p_zeros — SciPy v1.16.0 Manual (original) (raw)
scipy.special.
scipy.special.y1p_zeros(nt, complex=False)[source]#
Compute nt zeros of Bessel derivative Y1’(z), and value at each zero.
The values are given by Y1(z1) at each z1 where Y1’(z1)=0.
Parameters:
ntint
Number of zeros to return
complexbool, default False
Set to False to return only the real zeros; set to True to return only the complex zeros with negative real part and positive imaginary part. Note that the complex conjugates of the latter are also zeros of the function, but are not returned by this routine.
Returns:
z1pnndarray
Location of nth zero of Y1’(z)
y1z1pnndarray
Value of derivative Y1(z1) for nth zero
References
Examples
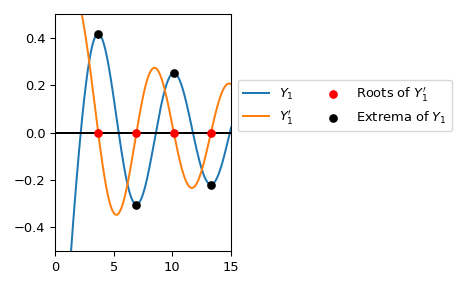
Compute the first four roots of \(Y_1'\) and the values of\(Y_1\) at these roots.
import numpy as np from scipy.special import y1p_zeros y1grad_roots, y1_values = y1p_zeros(4) with np.printoptions(precision=5): ... print(f"Y1' Roots: {y1grad_roots.real}") ... print(f"Y1 values: {y1_values.real}") Y1' Roots: [ 3.68302 6.9415 10.1234 13.28576] Y1 values: [ 0.41673 -0.30317 0.25091 -0.21897]
y1p_zeros can be used to calculate the extremal points of \(Y_1\)directly. Here we plot \(Y_1\) and the first four extrema.
import matplotlib.pyplot as plt from scipy.special import y1, yvp y1_roots, y1_values_at_roots = y1p_zeros(4) real_roots = y1_roots.real xmax = 15 x = np.linspace(0, xmax, 500) x[0] += 1e-15 fig, ax = plt.subplots() ax.plot(x, y1(x), label=r'$Y_1$') ax.plot(x, yvp(1, x, 1), label=r"$Y_1'$") ax.scatter(real_roots, np.zeros((4, )), s=30, c='r', ... label=r"Roots of Y1′Y_1'Y1′", zorder=5) ax.scatter(real_roots, y1_values_at_roots.real, s=30, c='k', ... label=r"Extrema of Y1Y_1Y1", zorder=5) ax.hlines(0, 0, xmax, color='k') ax.set_ylim(-0.5, 0.5) ax.set_xlim(0, xmax) ax.legend(ncol=2, bbox_to_anchor=(1., 0.75)) plt.tight_layout() plt.show()