MultinomialQMC — SciPy v1.15.3 Manual (original) (raw)
scipy.stats.qmc.
class scipy.stats.qmc.MultinomialQMC(pvals, n_trials, *, engine=None, rng=None)[source]#
QMC sampling from a multinomial distribution.
Parameters:
pvalsarray_like (k,)
Vector of probabilities of size k, where k is the number of categories. Elements must be non-negative and sum to 1.
n_trialsint
Number of trials.
engineQMCEngine, optional
Quasi-Monte Carlo engine sampler. If None, Sobol is used.
rngnumpy.random.Generator, optional
Pseudorandom number generator state. When rng is None, a newnumpy.random.Generator is created using entropy from the operating system. Types other than numpy.random.Generator are passed to numpy.random.default_rng to instantiate a Generator.
Changed in version 1.15.0: As part of the SPEC-007transition from use of numpy.random.RandomState tonumpy.random.Generator, this keyword was changed from seed to_rng_. For an interim period, both keywords will continue to work, although only one may be specified at a time. After the interim period, function calls using the seed keyword will emit warnings. Following a deprecation period, the seed keyword will be removed.
Examples
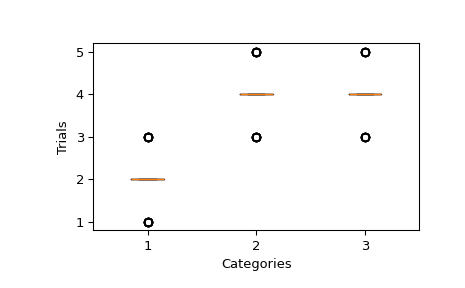
Let’s define 3 categories and for a given sample, the sum of the trials of each category is 8. The number of trials per category is determined by the pvals associated to each category. Then, we sample this distribution 64 times.
import matplotlib.pyplot as plt from scipy.stats import qmc dist = qmc.MultinomialQMC( ... pvals=[0.2, 0.4, 0.4], n_trials=10, engine=qmc.Halton(d=1) ... ) sample = dist.random(64)
We can plot the sample and verify that the median of number of trials for each category is following the pvals. That would bepvals * n_trials = [2, 4, 4].
fig, ax = plt.subplots() ax.yaxis.get_major_locator().set_params(integer=True) _ = ax.boxplot(sample) ax.set(xlabel="Categories", ylabel="Trials") plt.show()
Methods
| random([n]) | Draw n QMC samples from the multinomial distribution. |
|---|