theilslopes — SciPy v1.15.2 Manual (original) (raw)
scipy.stats.
scipy.stats.theilslopes(y, x=None, alpha=0.95, method='separate')[source]#
Computes the Theil-Sen estimator for a set of points (x, y).
theilslopes implements a method for robust linear regression. It computes the slope as the median of all slopes between paired values.
Parameters:
yarray_like
Dependent variable.
xarray_like or None, optional
Independent variable. If None, use arange(len(y)) instead.
alphafloat, optional
Confidence degree between 0 and 1. Default is 95% confidence. Note that alpha is symmetric around 0.5, i.e. both 0.1 and 0.9 are interpreted as “find the 90% confidence interval”.
method{‘joint’, ‘separate’}, optional
Method to be used for computing estimate for intercept. Following methods are supported,
- ‘joint’: Uses np.median(y - slope * x) as intercept.
- ‘separate’: Uses np.median(y) - slope * np.median(x)
as intercept.
The default is ‘separate’.
Added in version 1.8.0.
Returns:
resultTheilslopesResult instance
The return value is an object with the following attributes:
slopefloat
Theil slope.
interceptfloat
Intercept of the Theil line.
low_slopefloat
Lower bound of the confidence interval on slope.
high_slopefloat
Upper bound of the confidence interval on slope.
See also
a similar technique using repeated medians
Notes
The implementation of theilslopes follows [1]. The intercept is not defined in [1], and here it is defined as median(y) - slope*median(x), which is given in [3]. Other definitions of the intercept exist in the literature such as median(y - slope*x)in [4]. The approach to compute the intercept can be determined by the parameter method. A confidence interval for the intercept is not given as this question is not addressed in [1].
For compatibility with older versions of SciPy, the return value acts like a namedtuple of length 4, with fields slope, intercept,low_slope, and high_slope, so one can continue to write:
slope, intercept, low_slope, high_slope = theilslopes(y, x)
References
P.K. Sen, “Estimates of the regression coefficient based on Kendall’s tau”, J. Am. Stat. Assoc., Vol. 63, pp. 1379-1389, 1968.
[2]
H. Theil, “A rank-invariant method of linear and polynomial regression analysis I, II and III”, Nederl. Akad. Wetensch., Proc. 53:, pp. 386-392, pp. 521-525, pp. 1397-1412, 1950.
[3]
W.L. Conover, “Practical nonparametric statistics”, 2nd ed., John Wiley and Sons, New York, pp. 493.
Examples
import numpy as np from scipy import stats import matplotlib.pyplot as plt
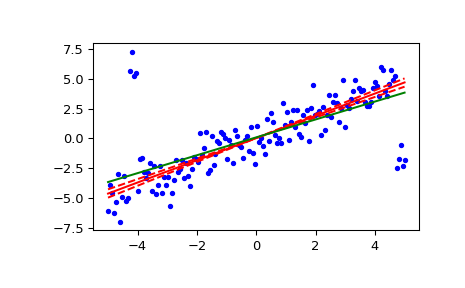
x = np.linspace(-5, 5, num=150) y = x + np.random.normal(size=x.size) y[11:15] += 10 # add outliers y[-5:] -= 7
Compute the slope, intercept and 90% confidence interval. For comparison, also compute the least-squares fit with linregress:
res = stats.theilslopes(y, x, 0.90, method='separate') lsq_res = stats.linregress(x, y)
Plot the results. The Theil-Sen regression line is shown in red, with the dashed red lines illustrating the confidence interval of the slope (note that the dashed red lines are not the confidence interval of the regression as the confidence interval of the intercept is not included). The green line shows the least-squares fit for comparison.
fig = plt.figure() ax = fig.add_subplot(111) ax.plot(x, y, 'b.') ax.plot(x, res[1] + res[0] * x, 'r-') ax.plot(x, res[1] + res[2] * x, 'r--') ax.plot(x, res[1] + res[3] * x, 'r--') ax.plot(x, lsq_res[1] + lsq_res[0] * x, 'g-') plt.show()