Execution-Time Profiling for PIL - MATLAB & Simulink (original) (raw)
Main Content
During a processor-in-the-loop (PIL) execution, you can produce a profile of the execution times for code generated from entry-point functions. The software calculates execution times from data that is obtained through instrumentation probes added to the PIL application.
Use the execution-time profile to check whether your code runs within the required time on your target hardware:
- If code execution overruns, look for ways to reduce execution time.
- If your code easily meets time requirements, consider enhancing functionality to exploit the unused processing power.
At the end of the PIL execution, you can:
- View a report of code execution times.
- Access and analyze execution time profiling data.
Note
PIL execution supports multiple entry-point functions. An entry-point function can call another entry-point function as a subfunction. However, the software generates execution-time profiles only for functions that are called at the entry-point level. The software does not generate execution-time profiles for entry-point functions that are called as subfunctions by other entry-point functions.
Note
When using PIL execution, make sure that the Benchmarking option in GPU Coder™ settings is false. Executing PIL with benchmarking results in compilation errors.
Generate Execution-Time Profile
Before running a processor-in-the-loop (PIL) execution, enable execution-time profiling in the GPU Coder app or code configuration object.
To enable code execution profiling in the GPU Coder app:
- To open the GPU Coder app, on the MATLAB® toolstrip Apps tab, under Code Generation, click the app icon. The app opens the Create GPU Coder Project dialog box.
- To open your project, click the Browse button and select the project.
- In the toolstrip, in the GPU Coder tab, set Output Type to Static Library.
- In the toolstrip, click Settings. In the Standalone Code Generation Settings dialog box, in the left pane, click Hardware. From the Hardware Board list, select
NVIDIA Jetson. To specify the address, username, and password, for the board, click Configure Hardware. - In the left pane, click Output. In the right pane, SetVerification mode to
PIL. - In the left pane, click Debugging. In the right pane, in theSIL/PIL section, select Enable entry point execution profiling.
- In the toolstrip, in the GPU Coder tab, click > . The app generates code and runs PIL execution on the NVIDIA® Jetson™.
Alternatively, use the coder.gpuConfig function to create a configuration object and enableCodeExecutionProfiling.
cfg = coder.gpuConfig("lib","ecoder",true); cfg.Hardware = coder.hardware("NVIDIA Jetson"); cfg.VerificationMode = "PIL"; cfg.CodeExecutionProfiling = true;
View Execution Times
When you run a PIL execution with execution time profiling enabled, the app displays the status of the PIL execution in the Output section of the GPU Coder panel. The MATLAB Command Window contains messages from the PIL execution.
Starting application: 'codegen\lib\mandelbrot_count\pil\mandelbrot_count.elf'
To terminate execution: clear mandelbrot_count_pil
Launching application mandelbrot_count.elf...
Execution profiling data is available for viewing. Open Simulation Data Inspector. Execution profiling report available after termination.
To open the execution-time profile, click the link in the MATLAB command Window to terminate the execution. The software terminates execution and displays a link to open the execution profiling report.
PIL execution terminated on target. Execution profiling report: coder.profile.show(getCoderExecutionProfile('mandelbrot_count'))
Click the link to open the report in the Code Profile Analyzer.
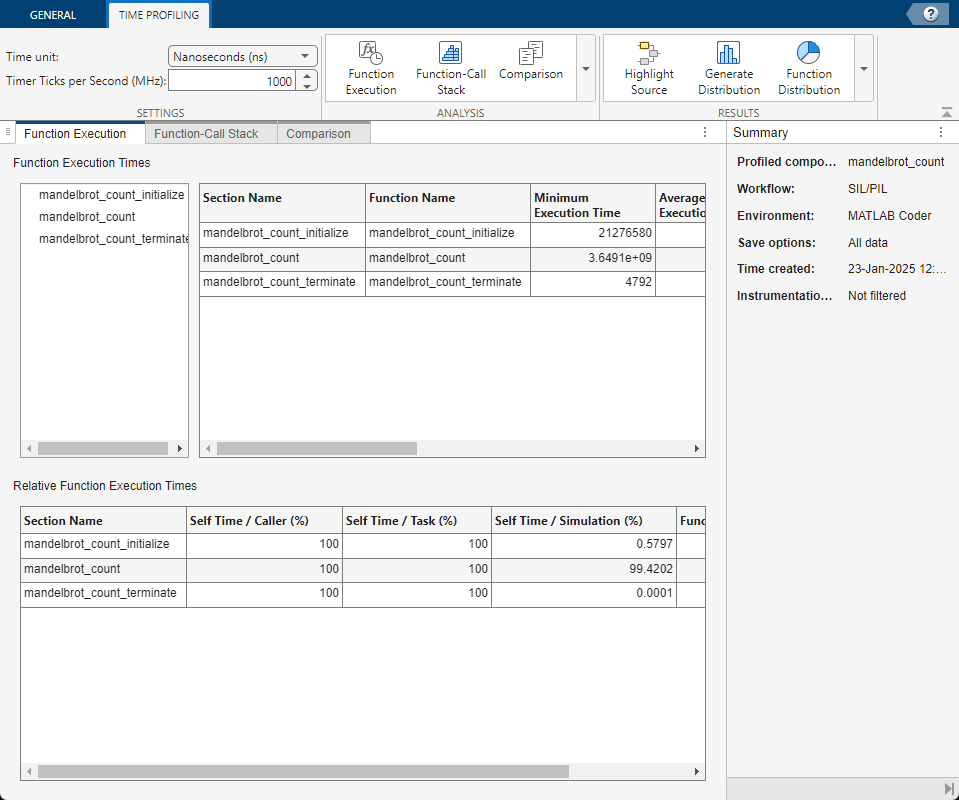
The app provides time measurements for:
- The
entrypointfn_initializefunction, for example,mandelbrot_count_initialize. - The entry-point function, for example,
mandelbrot_count. - The
entrypointfn_terminatefunction, for example,mandelbrot_count_terminate.
By default, the report displays time in nanoseconds. You can specify the time unit using the Time unit list in the app.
See Also
Functions
Objects
Apps
- Code Profile Analyzer (Embedded Coder)