Debug Generated Code During SIL or PIL Simulation - MATLAB & Simulink (original) (raw)
Main Content
If a software-in-the-loop (SIL) or processor-in-the-loop (PIL) simulation fails or you notice differences between the outputs of your original functions and the generated code, you can rerun the simulation with a debugger enabled. By inserting breakpoints, you can observe the behavior of code sections, which can help you to understand the cause of the issue.
For a SIL or PIL simulation failure, you can also view information from the standard output and standard error streams in the Diagnostic Viewer. For example:
- Output from
printfstatements in your code. - Error messages sent to
stderr. - Some low-level system messages.
During a SIL simulation, the target application redirects thestdout and stderr streams. When the application terminates, the Diagnostic Viewer displays the information from the redirected streams. The target application also provides a basic signal handler, which captures the POSIX® signals SIGFPE, SIGILL,SIGABRT, and SIGSEV. For this signal handler, the target application includes the file signal.h.
SIL Debugging
This table gives information about debugger support.
Note
You can perform SIL debugging only if the Simulink® product family supports your Microsoft Visual C++®, Xcode, or GNU GCC compiler. For more information, see supported compilers.
To enable your debugger for a SIL simulation, perform one of these actions:
- On the SIL/PIL tab, in theSettings gallery, under SIL/PIL Settings, click Debugging.
- In the Configuration Parameters dialog box, select theEnable source-level debugging for SIL or PIL check box.
If your top model has Model blocks, the Enable source-level debugging for SIL or PIL parameter for the top model overrides the corresponding parameter for referenced models.
When you run the SIL simulation, your_`model`_.c or_`model`_.cpp file opens, for example, in the Microsoft Visual Studio IDE with debugger breakpoints at the start of the_model_initialize andmodel__step functions.
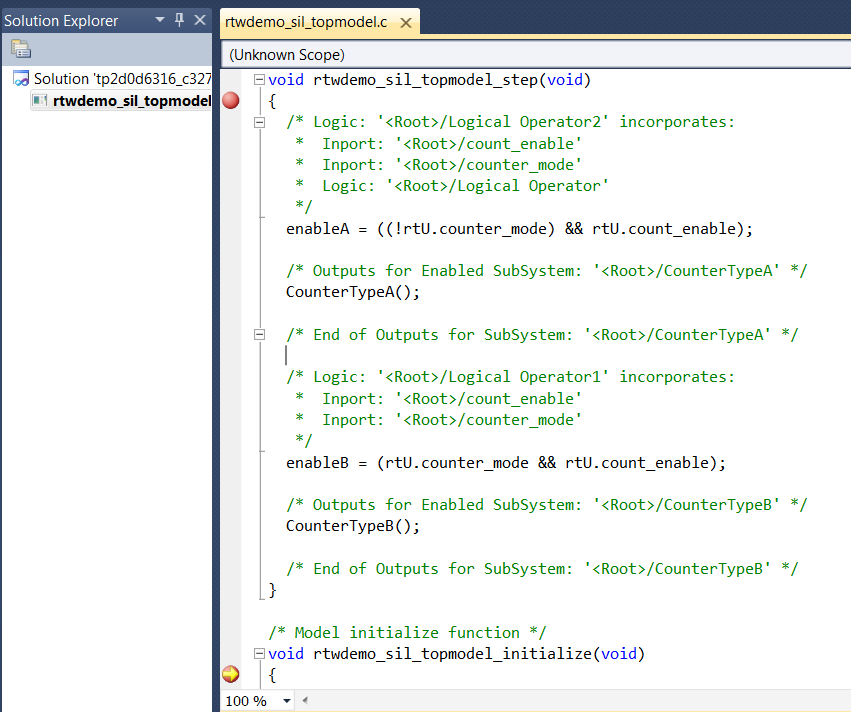
You can now use the debugger features to observe code behavior. For example, you can step through code and examine variables.
When using a dynamic link library (DLL), Microsoft Visual Studio applies two breakpoints per function breakpoint for SIL debugging: one for the C/C++ code function and another for the DLL entry point in disassembly code. When the debugger runs through the code, it reaches the DLL entry point first. To reach the corresponding point in the C/C++ code, click theContinue button (F5).
To end the debugging session:
- Remove all breakpoints.
- Click the Continue button (F5).
The SIL simulation runs to completion and the Microsoft Visual Studio IDE closes.
Note
In the Microsoft Visual Studio IDE, if you select > , the SIL simulation times out with the following error message:
The timeout of 1 seconds for receiving data from the rtiostream interface has been exceeded. There are multiple possible causes for this failure. ... ...
PIL Debugging
When you set up PIL connectivity between Simulink and the target hardware, specify a debugger by usingtarget.ExecutionService andtarget.DebugExecutionTool objects — see Support PIL Debugging and DebugExecutionTool Template.
To enable your debugger for a PIL simulation, perform one of these actions:
- On the SIL/PIL tab, in theSettings gallery, under SIL/PIL Settings, click Debugging.
- In the Configuration Parameters dialog box, select theEnable source-level debugging for SIL or PIL check box.
If your top model has Model blocks, the Enable source-level debugging for SIL or PIL parameter for the top model overrides the corresponding parameter for referenced models.