Optimized Chart Class for Displaying Variable Number of Lines - MATLAB & Simulink (original) (raw)
This example shows how to optimize a chart class for displaying a variable number of lines. It reuses existing line objects, which can improve the performance of the chart, especially if the number of lines does not change frequently. For a simpler version of this chart without the optimization, see Chart Class with Variable Number of Lines.
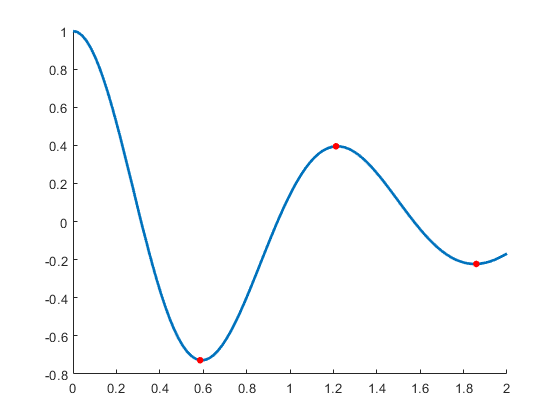
The chart displays as many lines as there are columns in the YData matrix, with circular markers at the local extrema. The following code demonstrates how to:
- Define two properties called
PlotLineArrayandExtremaLinethat store the objects for the lines and the markers, respectively. - Implement a
setupmethod that initializes theExtremaLineobject. - Implement an
updatemethod that gets the size of thePlotLineArray, and then adds or subtracts objects from that array according to the number of columns inYData.
To define the class, copy this code into the editor and save it with the name OptimLocalExtremaChart.m in a writable folder.
classdef OptimLocalExtremaChart < matlab.graphics.chartcontainer.ChartContainer % c = OptimLocalExtremaChart('XData',X,'YData',Y,Name,Value,...) % plots one line with markers at local extrema for every column of matrix Y. % You can also specify the additonal name-value arguments, 'MarkerColor' % and 'MarkerSize'.
properties
    XData (:,1) double = NaN
    YData (:,:) double = NaN
    MarkerColor {validatecolor} = [1 0 0]
    MarkerSize (1,1) double = 5
end
properties(Access = private,Transient,NonCopyable)
    PlotLineArray (:,1) matlab.graphics.chart.primitive.Line
    ExtremaLine (:,1) matlab.graphics.chart.primitive.Line
end

methods(Access = protected)
    function setup(obj)
        obj.ExtremaLine = matlab.graphics.chart.primitive.Line(...
            'Parent', obj.getAxes(), 'Marker', 'o', ...
            'MarkerEdgeColor', 'none', 'LineStyle',' none');
    end
    function update(obj)
        % Get the axes
        ax = getAxes(obj);

        % Create extra lines as needed
        p = obj.PlotLineArray;
        nPlotLinesNeeded = size(obj.YData, 2);
        nPlotLinesHave = numel(p);
        for n = nPlotLinesHave+1:nPlotLinesNeeded
            p(n) = matlab.graphics.chart.primitive.Line('Parent', ax, ...
                'SeriesIndex', n, 'LineWidth', 2);
        end

        % Update the lines
        for n = 1:nPlotLinesNeeded
            p(n).XData = obj.XData;
            p(n).YData = obj.YData(:,n);
        end

        % Delete unneeded lines
        delete(p((nPlotLinesNeeded+1):numel(p)))
        obj.PlotLineArray = p(1:nPlotLinesNeeded);

        % Replicate x-coordinate vectors to match size of YData
        newx = repmat(obj.XData(:),1,size(obj.YData,2));

        % Find local minima and maxima and plot markers
        tfmin = islocalmin(obj.YData,1);
        tfmax = islocalmax(obj.YData,1);
        obj.ExtremaLine.XData = [newx(tfmin); newx(tfmax)];
        obj.ExtremaLine.YData = [obj.YData(tfmin); obj.YData(tfmax)];
        obj.ExtremaLine.MarkerFaceColor = obj.MarkerColor;
        obj.ExtremaLine.MarkerSize = obj.MarkerSize;

        % Make sure the extrema are on top
        uistack(obj.ExtremaLine, 'top');
    end
end
end
After saving the class file, you can create an instance of the chart. For example:
x = linspace(0,2)'; y = cos(5*x)./(1+x.^2); c = OptimLocalExtremaChart('XData',x,'YData',y);
Now, create a for loop that adds an additional line to the plot at every iteration. The chart object keeps all the existing lines, and adds one additonal line for each i.
for i=1:10 y = cos(5*x+i)./(1+x.^2); c.YData = [c.YData y]; end
