Write Constructors for Chart Classes - MATLAB & Simulink (original) (raw)
When you develop a chart as a subclass of the ChartContainer base class, the base class provides a default constructor that accepts optional name-value pair arguments for setting chart properties. For example, this command creates an instance of a class calledConfidenceChart.
ConfidenceChart('XData',x,'YData',y,'ConfidenceMargin',0.15,'Color',[1 0 0])
By writing a custom constructor method, you can provide an interface that accepts individual argument values and optional name-value pair arguments. For example, you can design a custom constructor to change the calling syntax forConfidenceChart so that both of these commands are valid ways to create the chart:
ConfidenceChart(x,y,0.15) ConfidenceChart(x,y,0.15,'Color',[1 0 0])
When you write the constructor method:
- Specify the input arguments you want to support in the function declaration. Include
vararginas the last input argument to capture any property name-value pair arguments that the user specifies. - Call the
ChartContainerconstructor before all other references to the chart object.
For example, the following constructor method for theConfidenceChart class performs these tasks:
- Checks the number of input arguments and returns an error if the number is less than three.
- Converts the
x,y, andmarginvalues to the name-value pair arguments that theChartContainerconstructor accepts, and stores the results inargs. - Appends any user-specified name-value pair arguments to the end of
args. - Passes
argsto theChartContainerconstructor method.
methods function obj = ConfidenceChart(x,y,margin,varargin) % Check for at least three inputs if nargin < 3 error('Not enough inputs'); end
    % Convert x, y, and margin into name-value pairs
    args = {'XData', x, 'YData', y, 'ConfidenceMargin', margin};

    % Combine args with user-provided name-value pairs
    args = [args varargin];

    % Call superclass constructor method
    obj@matlab.graphics.chartcontainer.ChartContainer(args{:});
end
end
Example: Confidence Bounds Chart with Custom Constructor
This example shows how to develop a chart that has a custom constructor that accepts single-value input arguments and optional name-value pair arguments. The chart plots a line with markers and a surrounding confidence margin.
Create a program file named ConfidenceChart.m in a folder that is on the MATLAB® path. Define the class by following these steps.
| Step | Implementation |
|---|---|
| Derive from the ChartContainer base class. | classdef ConfidenceChart < matlab.graphics.chartcontainer.ChartContainer |
| Define public properties. | properties XData (1,:) double = NaN YData (1,:) double = NaN ConfidenceMargin (1,1) double = 0.15 MarkerSymbol (1,:) char = 'o' Color (1,3) double {mustBeGreaterThanOrEqual(Color,0),... mustBeLessThanOrEqual(Color,1)} = [1 0 0] end |
| Define private properties. | properties(Access = private,Transient,NonCopyable) LineObject (1,1) matlab.graphics.chart.primitive.Line PatchObject (1,1) matlab.graphics.primitive.Patch end |
| Implement the custom constructor method that accepts thex, y, andmargin values and optional property name-value pair arguments. | methods function obj = ConfidenceChart(x,y,margin,varargin) % Check for at least three inputs if nargin < 3 error('Not enough inputs'); end % Convert x, y, and margin into name-value pairs args = {'XData', x, 'YData', y, 'ConfidenceMargin', margin}; % Combine args with user-provided name-value pairs. args = [args varargin]; % Call superclass constructor method obj@matlab.graphics.chartcontainer.ChartContainer(args{:}); end end |
| Implement the setup method. | methods(Access = protected) function setup(obj) % get the axes ax = getAxes(obj); % Create Patch and objects obj.PatchObject = patch(ax,NaN,NaN,'r','FaceAlpha',0.2,... 'EdgeColor','none'); hold(ax,'on') obj.LineObject = plot(ax,NaN,NaN); hold(ax,'off') end |
| Implement the update method. | function update(obj) % Update XData and YData of Line obj.LineObject.XData = obj.XData; obj.LineObject.YData = obj.YData; % Update patch XData and YData x = obj.XData; obj.PatchObject.XData = [x x(end:-1:1)]; y = obj.YData; c = obj.ConfidenceMargin; obj.PatchObject.YData = [y+c y(end:-1:1)-c]; % Update colors obj.LineObject.Color = obj.Color; obj.PatchObject.FaceColor = obj.Color; % Update markers obj.LineObject.Marker = obj.MarkerSymbol; end end end |
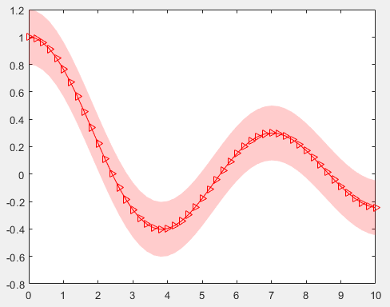
Next, create an instance of a ConfidenceChart. Specify the_x_- and _y_-coordinates, the margin value, and a marker symbol.
x = 0:0.2:10; y = besselj(0,x); ConfidenceChart(x,y,0.20,'MarkerSymbol','>');