cellplot - Graphically display structure of cell array - MATLAB (original) (raw)
Main Content
Graphically display structure of cell array
Syntax
cellplot(c) cellplot(c, 'legend') handles = cellplot(c)
Description
cellplot(c) displays a figure window that graphically represents the contents of c. Filled rectangles represent elements of vectors and arrays, while scalars and short character vectors are displayed as text.
cellplot(c, 'legend') places a colorbar next to the plot labeled to identify the data types in c.
handles = cellplot(c) displays a figure window and returns a vector of surface handles.
Limitations
The cellplot function can display only two-dimensional cell arrays.
Examples
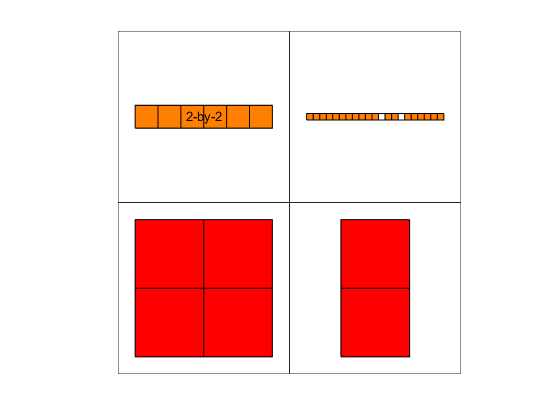
Consider a 2-by-2 cell array containing a matrix, a vector, and two character vectors:
c{1,1} = '2-by-2'; c{1,2} = 'eigenvalues of eye(2)'; c{2,1} = eye(2); c{2,2} = eig(eye(2));
The command cellplot(c) produces
Version History
Introduced before R2006a