imtile - Combine multiple image frames into one rectangular tiled image - MATLAB (original) (raw)
Combine multiple image frames into one rectangular tiled image
Syntax
Description
[out](#mw%5F74c14f99-0a58-4438-86f8-9fb2a8fc8746) = imtile([filenames](#mw%5Fa5efed8b-edbd-4d69-aa62-9dfab90a3813)) returns a tiled image containing the images in the files with file namesfilenames.
By default, the imtile function arranges the images so that they roughly form a square. You can change the arrangement using optional name-value arguments. The images can have different sizes and data types.
- If you specify an indexed image, then the
imtilefunction converts it to RGB using the colormap present in the file. - If there is a data type mismatch between images, then the
imtilefunction converts all images to data typedoubleusing the im2double function.
[out](#mw%5F74c14f99-0a58-4438-86f8-9fb2a8fc8746) = imtile([I](#mw%5Fccf8b423-8593-4e7c-b534-e2ed0522de33)) returns a tiled image containing all the frames of the multiframe image array I. A multiframe image array can be a sequence of binary, grayscale, or truecolor images.
[out](#mw%5F74c14f99-0a58-4438-86f8-9fb2a8fc8746) = imtile([images](#mw%5Fc8f524a5-cae3-4420-acaa-69664f7883f2)) returns a tiled image containing the images specified in the cell array images.imtile displays empty cell array elements as a blank tile.
[out](#mw%5F74c14f99-0a58-4438-86f8-9fb2a8fc8746) = imtile([imds](#mw%5F4b3a4802-d027-4e78-bf33-f3ae69d1965c)) returns a tiled image containing the images specified in the image datastoreimds. For information about image datastores, see ImageDatastore.
[out](#mw%5F74c14f99-0a58-4438-86f8-9fb2a8fc8746) = imtile(___,[map](#mw%5F838c9403-3656-4bf3-8969-25c9f41e6411)) returns a tiled image in which grayscale, indexed, and binary images are converted to RGB using the colormap map. You can specify input images using the input argument of any of the preceding syntaxes. Note that if you specify images using file namesfilenames, and also specify the colormap, thenmap overrides any internal colormap present in the image files.
[out](#mw%5F74c14f99-0a58-4438-86f8-9fb2a8fc8746) = imtile(___,[Name=Value](#namevaluepairarguments)) returns a customized tiled image, depending on the values of the optional name-value arguments.
Examples
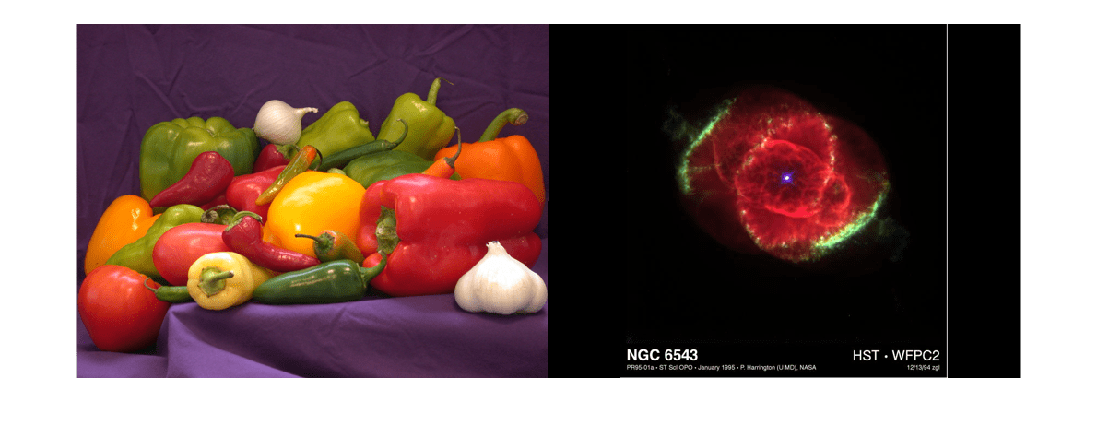
Specify two image files, then create a tiled image containing the images.
files = ["peppers.png","ngc6543a.jpg"]; out = imtile(files);
Display the tiled image.
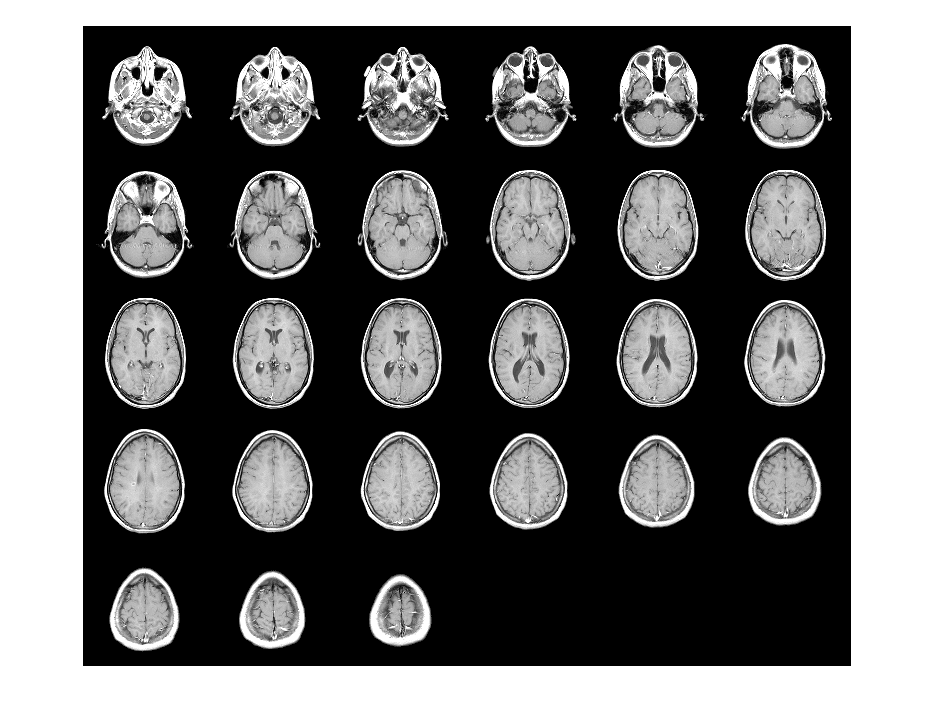
Load the MRI data set that contains a volumetric image and a colormap.
Create a tiled image from all slices in the image volume.
out = imtile(D,map); imshow(out)
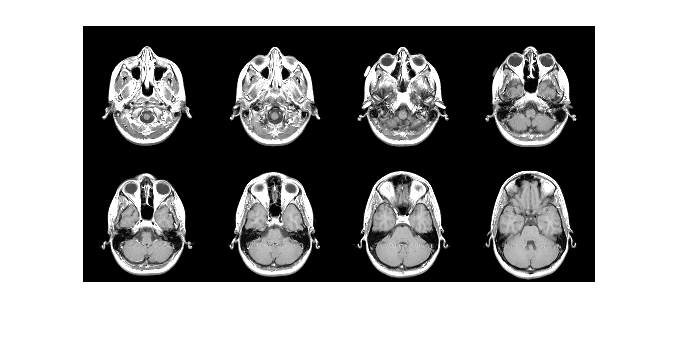
Create a tiled image containing only the first eight images in the data set. Arrange the images in a 2-by-4 grid by using the GridSize name-value argument.
out = imtile(D,map,Frames=1:8,GridSize=[2 4]); imshow(out)
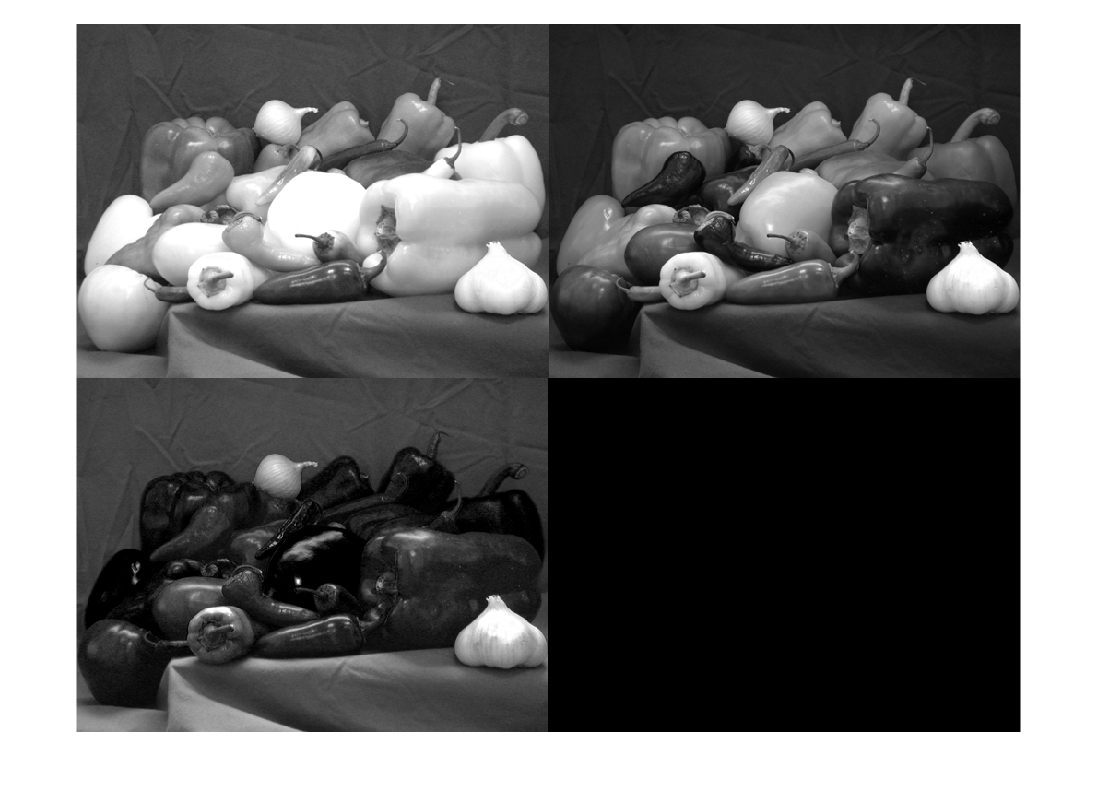
Read an RGB image into the workspace.
imRGB = imread('peppers.png');
Create a tiled image containing each of the three planes of the RGB image. Display the tiled image.
out = imtile(imRGB); imshow(out)
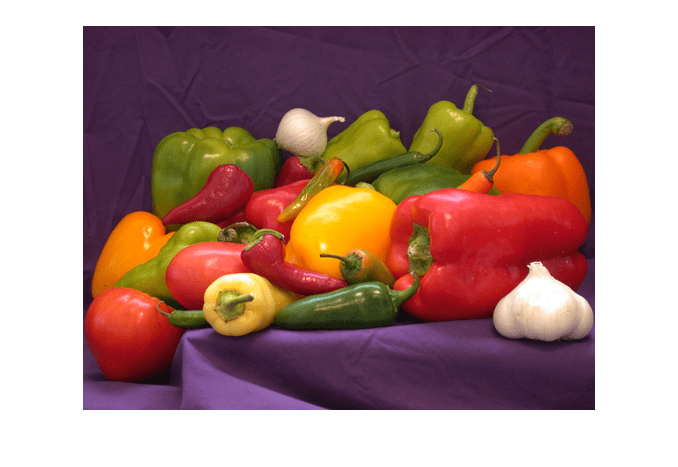
From an image datastore, create and customize a tiled image.
Create an image datastore containing all the files with the file extension "tif" or "png" in the specified folder.
fileFolder = fullfile(matlabroot,"toolbox","matlab","matlab_images"); imds = imageDatastore(fileFolder,IncludeSubfolders=true, ... FileExtensions=[".tif",".png"]);
Create a tiled image containing the images in the datastore.
out1 = imtile(imds); imshow(out1)
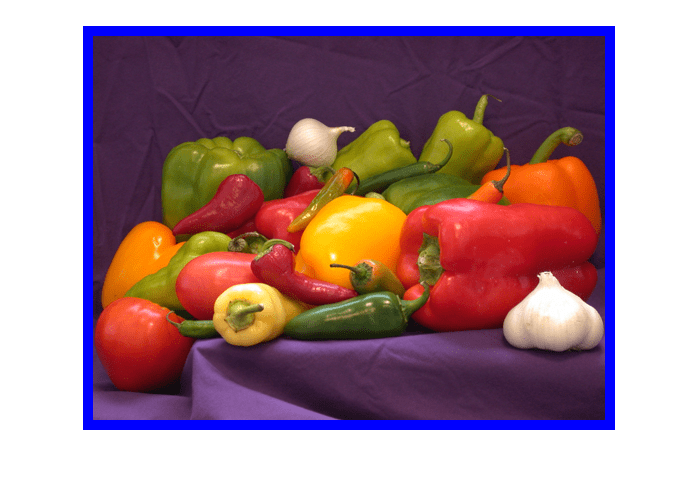
Add a blue border to the tiled image by using the BorderSize and BackgroundColor name-value arguments.
out2 = imtile(imds,BorderSize=10,BackgroundColor="b"); figure imshow(out2)
Input Arguments
Names of files containing images, specified as an _f_-by-1 string array, a 1-by-f string array, a character vector, or a cell array of character vectors. If the files are not in the current folder or in a folder on the MATLAB® path, then specify the full path name. For more information, see imread.
Example: 'file1.jpg'
Example: ["file1.jpg" "file2.jpg"]
Example: '../dir/data/file1.png'
Example: {'C:\dir\data\file1.tif','C:\dir\data\file2.tif'}
Data Types: char | string | cell
Multiframe image, specified as a numeric array. I can be:
- An _m_-by-_n_-by-k array representing a sequence of k binary, grayscale, or indexed images
- An _m_-by-_n_-by-1-by-k array representing a sequence of k binary, grayscale, or indexed images
- An _m_-by-_n_-by-3-by-k array representing a sequence of k truecolor images
List of images, specified as an _k_-by-1 or 1-by-k cell array of numeric matrices. The cell array can contain numeric matrices of size _m_-by-n or_m_-by-_n_-by-3.
Colormap, specified as a _c_-by-3 numeric matrix with values in the range [0,1]. Each row of map is a three-element RGB triplet that specifies the red, green, and blue components of a single color. When you specifymap, the imtile function converts all indexed, grayscale, and binary images to truecolor using this colormap.
Data Types: double
Name-Value Arguments
Specify optional pairs of arguments asName1=Value1,...,NameN=ValueN, where Name is the argument name and Value is the corresponding value. Name-value arguments must appear after other arguments, but the order of the pairs does not matter.
Example: imtile("peppers.png",BackgroundColor="g"); specifies a green background color.
Before R2021a, use commas to separate each name and value, and enclose Name in quotes.
Example: imtile("peppers.png","BackgroundColor","g");
Color of the background, specified as an RGB triplet, a color name, or a short color name. The imtile function fills all blank spaces with this color, including the space specified by BorderSize.
You can specify any color using an RGB triplet. An RGB triplet is a 3-element row vector whose elements specify the intensities of the red, green, and blue components of the color. The intensities must be in the range [0,1].
You can specify some common colors by name as a string scalar or character vector. This table lists the named color options and the equivalent RGB triplets.
| Color Name | Short Name | RGB Triplet | Appearance |
|---|---|---|---|
| "red" | "r" | [1 0 0] |  |
| "green" | "g" | [0 1 0] |  |
| "blue" | "b" | [0 0 1] |  |
| "cyan" | "c" | [0 1 1] |  |
| "magenta" | "m" | [1 0 1] |  |
| "yellow" | "y" | [1 1 0] |  |
| "black" | "k" | [0 0 0] |  |
| "white" | "w" | [1 1 1] |  |
Example: "BackgroundColor","r"
Example: "BackgroundColor","green"
Example: "BackgroundColor",[0 0.4470 0.7410]
Padding around each thumbnail image, specified as a numeric scalar or 1-by-2 numeric vector of the form [brows bcols]. Theimtile function pads the borders of each image with the background color.
Frames to include, specified as a numeric array or a logical mask. Theimtile function interprets the values as indices into the image array or cell array. The following examples create a tiled image containing the first three image frames.
Example: out = imtile(I,Frames=1:3);
Example: out = imtile(I,Frames=[true true true]);
Number of rows and columns of thumbnails in the tiled image, specified as a two-element vector of the form [nrows ncols].nrows specifies the number of rows in the grid andncols specifies the number of columns in the grid. UseNaNs or Infs to haveimtile calculate the size in a particular dimension in a way that includes all the images.
- If
GridSizeis[2 NaN], thenimtilecreates a tiled image with two rows and the number of columns necessary to include all the images. - If both the elements are
NaNorInf, thenimtilecalculates the grid size to form a square.imtilereturns the images horizontally across columns. - If there is a mismatch between
GridSizeand number of images (frames), thenimtilecreates the tiled image based onGridSize.
Interpolation method to resize images for thumbnails, specified as one of these values.
| Method | Description |
|---|---|
| "bicubic" | Bicubic interpolation; the output pixel value is a weighted average of pixels in the nearest 4-by-4 neighborhood.NoteBicubic interpolation can produce pixel values outside the original range. |
| "bilinear" | Bilinear interpolation; the output pixel value is a weighted average of pixels in the nearest 2-by-2 neighborhood. |
| "nearest" | Nearest-neighbor interpolation; the output pixel is assigned the value of the pixel that the point falls within. No other pixels are considered. |
| "box" | Box-shaped interpolation kernel |
| "triangle" | Triangular interpolation kernel (equivalent to"bilinear") |
| "cubic" | Cubic interpolation kernel (equivalent to"bicubic") |
| "lanczos2" | Lanczos-2 interpolation kernel |
| "lanczos3" | Lanczos-3 interpolation kernel |
The default resizing method, "bicubic", typically works well when the images are larger than the thumbnails. If the size of your images is smaller than the thumbnails and you want to avoid smoothing the pixel values, then consider setting ThumbnailInterpolation as"nearest".
Data Types: char | string
Size of thumbnails, specified as a two-element vector of the form [trows tcols], in pixels. The imtile function preserves the aspect ratio of the original image by zero-padding the boundary.
- If you specify a
NaNorInf, then theimtilefunction calculates the corresponding value automatically to preserve the aspect ratio of the first image. - If you specify an empty array (
[]), then theimtilefunction uses the full size of the first image as the thumbnail size.
Output Arguments
Tiled output image, returned as a numeric matrix or a numeric array. The output image is an _M_-by-_N_-by-3 numeric array when any of these conditions are true:
- At least one of the input images is an RGB image or indexed image
- You specify a colormap, map
- You specify a background color, BackgroundColor, regardless of whether the tiled image includes background pixels or not
Extended Capabilities
Version History
Introduced in R2018b
The new ThumbnailInterpolation name-value argument enables you to specify the interpolation method used to resize images for thumbnails.