Binscatter - Binscatter appearance and behavior - MATLAB (original) (raw)
Binscatter Properties
Binscatter appearance and behavior
Binscatter properties control the appearance and behavior of binned scatter plots. By changing property values, you can modify aspects of the display. Use dot notation to refer to a particular object and property:
h = binscatter(randn(1,100),randn(1,100)); N = h.NumBins h.NumBins = [3 3]
Bins
Number of bins, specified as a scalar or two-element vector [Nx Ny].
- If
NumBinsis specified as a two-element vector[Nx Ny], thenbinscatterusesNxbins in the x dimension andNybins in the y dimension. - If
NumBinsis specified as a scalar, thenNxandNyare both set to the scalar value.
binscatter uses Nx andNy bins along the x and_y_ dimensions in the initial plot, when the axes are not zoomed in. (The axes are not zoomed in when theXLimMode and YLimMode properties are both 'auto'.) When zooming,binscatter adjusts the number of bins to maintain a bin size such that the visible portion of the plot is approximately divided into Nx-by-Ny bins.
The maximum number of bins in each dimension is 250. The default number of bins is computed based on the data size and standard deviation and does not exceed 100.
Example: [10 20]
Data Types: single | double | int8 | int16 | int32 | int64 | uint8 | uint16 | uint32 | uint64
Selection mode for number of bins, specified as either'auto' or 'manual'. With the default value of 'auto', the number of bins is computed from the data according to Scott's rule,[3.5*std(X(:))*numel(X)^(-1/4), 3.5*std(Y(:))*numel(Y)^(-1/4)].
If you specify the number of bins, then the value of'NumBinsMode' is set to'manual'.
Toggle to show empty bins, specified as either 'off' or'on', or as numeric or logical 1 (true) or 0 (false). A value of'on' is equivalent to true, and'off' is equivalent to false. Thus, you can use the value of this property as a logical value. The value is stored as an on/off logical value of type matlab.lang.OnOffSwitchState.
Specify 'on' or true to color tiles in the plot that fall within the bin limits, but have no data points.
This property is read-only.
Bin edges in _x_-dimension, returned as a vector.
Data Types: single | double | datetime | duration
This property is read-only.
Bin edges in y dimension, returned as a vector.
Data Types: single | double | datetime | duration
Data limits in _x_-dimension, specified as a two-element vector[Xmin Xmax].
binscatter only displays data points that fall within the specified data limits inclusively, Xmin≤X≤Xmax.
Example: [0 10]
Data Types: single | double | int8 | int16 | int32 | int64 | uint8 | uint16 | uint32 | uint64 | datetime | duration
Selection mode for data limits in _x_-dimension, specified as 'auto' or 'manual'. The default value is 'auto', so that the bin limits automatically adjust to the data along the _x_-axis.
If you explicitly specify XLimits, thenXLimitsMode is automatically set to'manual'. In that case, specifyXLimitsMode as 'auto' to rescale the bin limits to the data.
Data limits in _y_-dimension, specified as a two-element vector[Ymin Ymax].
binscatter only displays data points that fall within the specified data limits inclusively, Ymin≤Y≤Ymax.
Example: [0 10]
Data Types: single | double | int8 | int16 | int32 | int64 | uint8 | uint16 | uint32 | uint64 | datetime | duration
Selection mode for data limits in _y_-dimension, specified as 'auto' or 'manual'. The default value is 'auto', so that the bin limits automatically adjust to the data along the _y_-axis.
If you explicitly specify YLimits, thenYLimitsMode is automatically set to'manual'. In that case, specifyYLimitsMode as 'auto' to rescale the bin limits to the data.
Data
x coordinates of data, specified as a vector.
Data Types: single | double | int8 | int16 | int32 | int64 | uint8 | uint16 | uint32 | uint64 | datetime | duration
y coordinates of data, specified as a vector.
Data Types: single | double | int8 | int16 | int32 | int64 | uint8 | uint16 | uint32 | uint64 | datetime | duration
This property is read-only.
Bin values, returned as a double matrix. The (i,j)th entry in Values specifies the bin count for the bin whose_x_ edges are [XBinEdges(i), XBinEdges(i+1)] and whose y edges are[YBinEdges(j), YBinEdges(j+1)].
The bin inclusion scheme for the different numbered bins inValues, as well as their relative orientation to the_x_-axis and _y_-axis, is
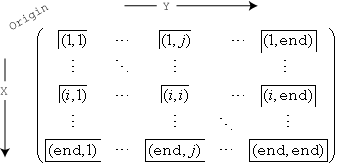
For example, the (1,1) bin includes values that fall on the first edge in each dimension. The last bin in the bottom right includes values that fall on any of its edges.
Transparency
Transparency of tiles, specified as a scalar value between0 and 1 inclusive.binscatter uses the same transparency for all the tiles. A value of 1 means fully opaque and0 means completely transparent (invisible).
Example: binscatter(X,Y,'FaceAlpha',0.5) creates a binned scatter plot with semitransparent bins.
Legend
Text used by the legend, specified as a character vector. The text appears next to an icon of the binscatter.
Example: 'Text Description'
For multiline text, create the character vector usingsprintf with the new line character\n.
Example: sprintf('line one\nline two')
Alternatively, you can specify the legend text using the legend function.
- If you specify the text as an input argument to the legend function, then the legend uses the specified text and sets the
DisplayNameproperty to the same value. - If you do not specify the text as an input argument to thelegend function, then the legend uses the text in the
DisplayNameproperty. The default value ofDisplayNameis one of these values.- For numeric inputs,
DisplayNameis a character vector representing the variable name of the input data used to construct the histogram. If the input data does not have a variable name, thenDisplayNameis empty,''. - For categorical array inputs,
DisplayNameis empty,''.
- For numeric inputs,
If the DisplayName property does not contain any text, then the legend generates a character vector. The character vector has the form 'dataN', whereN is the number assigned to the binscatter object based on its location in the list of legend entries.
If you edit interactively the character vector in an existing legend, then MATLAB® updates the DisplayName property to the edited character vector.
Interactivity
Data tip content, specified as a DataTipTemplate object. You can control the content that appears in a data tip by modifying the properties of the underlying DataTipTemplate object. For a list of properties, seeDataTipTemplate Properties.
For an example of modifying data tips, see Create Custom Data Tips.
Note
The DataTipTemplate object is not returned byfindobj or findall, and it is not copied by copyobj.
Callbacks
Callback Execution Control
This property is read-only.
Parent/Child
Parent, specified as an Axes object.
Identifiers
This property is read-only.
Type of graphics object, returned as 'binscatter'. Use this property to find all objects of a given type within a plotting hierarchy, such as searching for the type using findobj.
Object identifier, specified as a character vector or string scalar. You can specify a unique Tag value to serve as an identifier for an object. When you need access to the object elsewhere in your code, you can use the findobj function to search for the object based on the Tag value.
Version History
Introduced in R2017b
Starting in R2020a, using the UIContextMenu property to assign a context menu to a graphics object or UI component is not recommended. Use the ContextMenu property instead. The property values are the same.
There are no plans to remove support for the UIContextMenu property at this time. However, the UIContextMenu property no longer appears in the list returned by calling the get function on a graphics object or UI component.