Stack Table Variables - Combine values from multiple table variables into one table variable in the Live
Editor - MATLAB ([original](https://in.mathworks.com/help/matlab/ref/stacktablevariables.html)) ([raw](?raw))Main Content
Combine values from multiple table variables into one table variable in the Live Editor
Description
The Stack Table Variables task enables you to interactively stack values from multiple table or timetable variables into one variable. The task automatically generates MATLAB® code for your live script. The generated code uses the stack function.
To stack variables means to interleave values from specified variables into one variable of the output. Stacking also adds an indicator variable to the output. In each row of the output, the value of the indicator variable indicates which variable of the input provided the data. The diagram shows the result of stacking a table.

Open the Task
To add the Stack Table Variables task to a live script in the MATLAB Editor:
- On the Live Editor tab, select > .
- Or, in a code block in the script, type a relevant keyword, such as
stack. Select from the suggested command completions.
Examples
This example shows how to stack variables by using the Stack Table Variables Live Editor task. It takes values from multiple variables in an input table, and combines them into one variable in an output table.
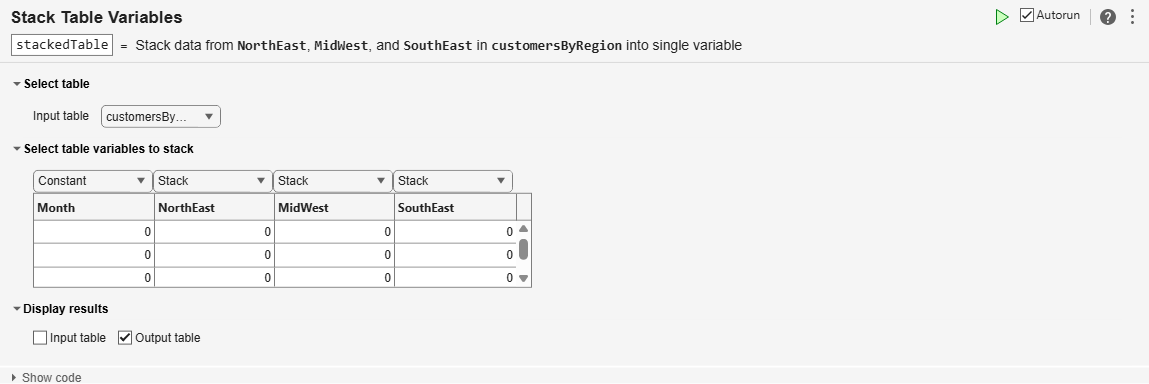
First, load a table from a sample file that lists the number of power company customers who experienced electric power outages. The sample data are aggregated by month. The power company serves three regions in the United States. So there are three variables, NorthEast, MidWest, and SouthEast, that list the numbers of customers affected in each region.
load customersByRegion.mat customersByRegion
customersByRegion=6×4 table Month NorthEast MidWest SouthEast _____________ _________ _______ _________
 October-2023       3492         565       1027
November-2023       2944        1293        834
December-2023       2559         936       1412
 January-2024      12045       50117          0
February-2024       4931        1089        137
   March-2024       3018         942        870
Stack the customer outage data so that the numbers from the NorthEast, MidWest, and SouthEast variables are in one variable in the output table.
Add the Stack Table Variables task to your live script.
- To copy values from the
Monthvariable to rows of the output table, selectConstantfrom the drop-down list above it in the task. - To combine the values from the
NorthEast,MidWest, andSouthEastvariables by stacking them into one variable of the output, selectStackfor each variable.
The name of the stacked variable in the output comes from combining the input variable names.
The task also stacks the names of the input variables into a new variable, named NorthEast_MidWest_SouthEast_Indicator, that indicates the regions for the customer outage data.
stackedTable=18×3 table Month NorthEast_MidWest_SouthEast_Indicator NorthEast_MidWest_SouthEast _____________ _____________________________________ ___________________________
 October-2023                  NorthEast                              3492
 October-2023                  MidWest                                 565
 October-2023                  SouthEast                              1027
November-2023                  NorthEast                              2944
November-2023                  MidWest                                1293
November-2023                  SouthEast                               834
December-2023                  NorthEast                              2559
December-2023                  MidWest                                 936
December-2023                  SouthEast                              1412
 January-2024                  NorthEast                             12045
 January-2024                  MidWest                               50117
 January-2024                  SouthEast                                 0
February-2024                  NorthEast                              4931
February-2024                  MidWest                                1089
February-2024                  SouthEast                               137
   March-2024                  NorthEast                              3018
  ⋮
Give the variables of the output table more meaningful names. To rename table variables, use the renamevars function.
customersOutage = renamevars(stackedTable, ... ["NorthEast_MidWest_SouthEast_Indicator" "NorthEast_MidWest_SouthEast"], ... ["Region" "CustomersOutage"])
customersOutage=18×3 table Month Region CustomersOutage _____________ _________ _______________
 October-2023    NorthEast          3492
 October-2023    MidWest             565
 October-2023    SouthEast          1027
November-2023    NorthEast          2944
November-2023    MidWest            1293
November-2023    SouthEast           834
December-2023    NorthEast          2559
December-2023    MidWest             936
December-2023    SouthEast          1412
 January-2024    NorthEast         12045
 January-2024    MidWest           50117
 January-2024    SouthEast             0
February-2024    NorthEast          4931
February-2024    MidWest            1089
February-2024    SouthEast           137
   March-2024    NorthEast          3018
  ⋮
Related Examples
Parameters
Specify the name of the input table or timetable timetables from the lists of all the nonempty tables and timetables that are in the workspace.
Specify the action to take for each variable in the input table or timetable. When stacking variables, there are three possible actions:
- — Copy the variable to the output table or timetable. Replicate its values where needed in rows of the output.
- — Stack the values from the variable into one variable of the output. For example, if you choose to stack three variables, all their values go into one variable of the output.
- — Exclude the variable and its values from the output.
Version History
Introduced in R2020a
This Live Editor task does not run automatically if the inputs have more than 1 million elements. In previous releases, the task always ran automatically for inputs of any size. If the inputs have a large number of elements, then the code generated by this task can take a noticeable amount of time to run (more than a few seconds).
When a task does not run automatically, the Autorun indicator is disabled. You can either run the task manually when needed or choose to enable the task to run automatically.