Perform Data Acquisition and Processing on Pool Workers - MATLAB & Simulink (original) (raw)
Main Content
This example shows how to implement a parallel data acquisition and processing pipeline on an interactive parallel pool. The pipeline uses PollableDataQueue objects to facilitate data transfer between workers in the parallel pool.
Starting in R2025a, you can create PollableDataQueue objects that the client or any worker can poll for data. Use this type of PollableDataQueue object to transfer data or messages between workers in pipeline workflows or in applications where multiple workers need access to a single PollableDataQueue object.
This example demonstrates how to parallelize an image acquisition and processing pipeline. You can adapt this approach to accelerate any pipeline workflow.
Parallel Data Processing Pipeline
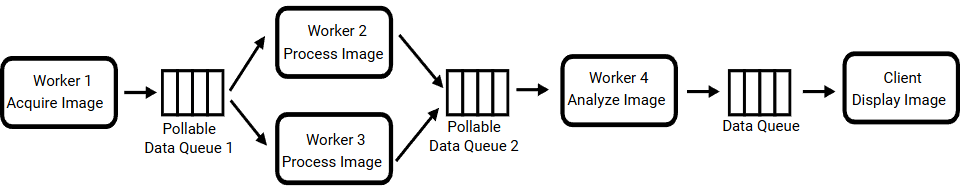
In this example, you capture streaming images of a simulated pendulum in motion. You then perform real-time image processing and analysis on each frame to determine the center of the pendulum. In this setup, one worker from the parallel pool acquires image data from a simulation and passes the data to a PollableDataQueue object. Two other workers poll this queue to receive and process the data and then send it to another PollableDataQueue object. A fourth worker polls this second queue to receive and analyze the data, finally sending it to a DataQueue object with a callback function that displays the results on the client.
Set Up Parallel Environment and Data Queues
Start a parallel pool with four workers.
pool = parpool("Processes",4);
Starting parallel pool (parpool) using the 'Processes' profile ... Connected to parallel pool with 4 workers.
Prepare and initialize plots to visualize data from the workers. The prepareDisplay function is defined at the end of this example.
[fig,p,himage] = prepareDisplay;
To enable data transfer between the workers, create PollableDataQueue objects with the Destination argument set to "any". When you set the Destination argument to "any", the client or any worker can poll the resulting queue for data.
Create two PollableDataQueue objects with Destination set to "any" for the data acquisition and processing stages of the pipeline.
acquisitionToProcessingPdq = parallel.pool.PollableDataQueue(destination="any"); processingToAnalysisPdq = parallel.pool.PollableDataQueue(destination="any");
Create an additional PollableDataQueue object to enable the client to send messages to the worker performing the data acquisition.
stopSignalPdq = parallel.pool.PollableDataQueue(destination="any");
To visualize the processed images and result data on the client, create a DataQueue object, displayResultsDq. Use the afterEach function to run the displayOnClient function when workers send data to the displayResultsDq object. The displayOnClient function is defined at the end of this example.
displayResultsDq = parallel.pool.DataQueue; afterEach(displayResultsDq,@(results) displayOnClient(p,himage,results));
Define Functions for Parallel Pipeline
To manage data flow and smoothly stop computations in the pipeline, define a different function for each stage: data acquisition, data processing, and data analysis. Each function uses specific queues to facilitate data transfer and communication between workers.
Data Acquisition Stage
In the acquireData function, a worker captures data and sends it to the acquisitionToProcessingPdq queue. The worker continuously acquires data until it receives a stop signal from the stopSignalPdq queue, then it closes the acquisitionToProcessingPdq queue. The worker simulates data acquisition at a specified rate using the generateFrames function. The generateFrames function is attached to this example as a supporting file.
function acquireData(stopSignalPdq,acquisitionToProcessingPdq) while isempty(poll(stopSignalPdq)) rawData = generateFrames(10); send(acquisitionToProcessingPdq,rawData); end close(acquisitionToProcessingPdq); clear generateFrames send(stopSignalPdq,"Data acquisition stopped")
end
Data Processing Stage
In the processData function, a worker polls the acquisitionToProcessingPdq queue for new data, processes it, and sends the results to the processingToAnalysisPdq queue. The loop continues until the worker running the data acquisition stage closes the acquisitionToProcessingPdq queue. When the acquisitionToProcessingPdq queue is closed and no data is available in the queue, poll returns the status indicator OK as false. The worker then stops waiting for data and closes the processingToAnalysisPdq queue. The processFrames function is attached to this example as a supporting file.
function processData(acquisitionToProcessingPdq,processingToAnalysisPdq) OK = true; while OK [rawFrame,OK] = poll(acquisitionToProcessingPdq,Inf); if OK processedFrames = processFrames(rawFrame); send(processingToAnalysisPdq,processedFrames); end end close(processingToAnalysisPdq); end
Final Data Analysis Stage
In the analyzeData function, a worker polls the processingToAnalysisPdq queue for processed data, analyzes it, and sends the results to the displayResultsDq queue. The loop continues until a worker running the previous stage closes the processingToAnalysisPdq queue and the worker drains the queue. When the processingToAnalysisPdq queue is closed and no data is available in the queue, poll returns the status indicator OK as false. The worker then stops waiting for data. The findPendulumCenters function is attached to this example as a supporting file.
function allCentroids = analyzeData(processingToAnalysisPdq,displayResultsDq) idx = 0; OK = true; while OK [processedFrames,OK] = poll(processingToAnalysisPdq,Inf); if OK idx = idx+1; results = findPendulumCenters(processedFrames); allCentroids(idx,:) = results.centroids; send(displayResultsDq,results); end end end
Start and Stop Data Acquisition and Analysis
To execute a different function on each worker, use the parfeval function. parfeval allows you to run tasks asynchronously without blocking MATLAB®.
Instruct a worker to begin acquiring data.
captureF = parfeval(@acquireData,0,stopSignalPdq,acquisitionToProcessingPdq);
Instruct two workers to execute the data processing function.
processFOne = parfeval(@processData,0,acquisitionToProcessingPdq,processingToAnalysisPdq); processFTwo = parfeval(@processData,0,acquisitionToProcessingPdq,processingToAnalysisPdq);
Instruct the final worker to perform data analysis and send the results to the client.
analyzeF = parfeval(@analyzeData,1,processingToAnalysisPdq,displayResultsDq);
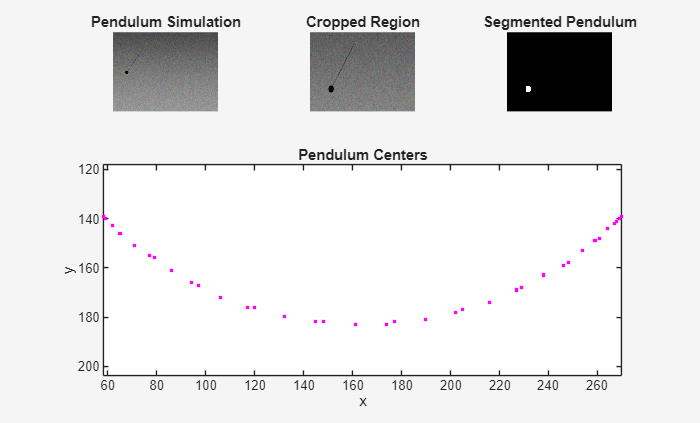
This figure displays the input frame, processed frame, and analysis results from the workers.
The parfeval function does not block MATLAB, so you can continue working while computations take place. The workers process the different stages of the pipeline in parallel and send intermediate results to the client as soon as they become available.
Collect and analyze data for a fixed amount of time.
Send a message to the stopSignalPdq queue. The worker running the data acquisition periodically polls this queue for messages. When the worker receives a message, the worker stops data acquisition and closes the acquisitionToProcessingPdq queue.
send(stopSignalPdq,"stop");
Wait for the last worker in the pipeline to complete its parfeval computation.
Confirm that the data acquisition worker successfully stopped acquiring data.
status = poll(stopSignalPdq)
status = "Data acquisition stopped"
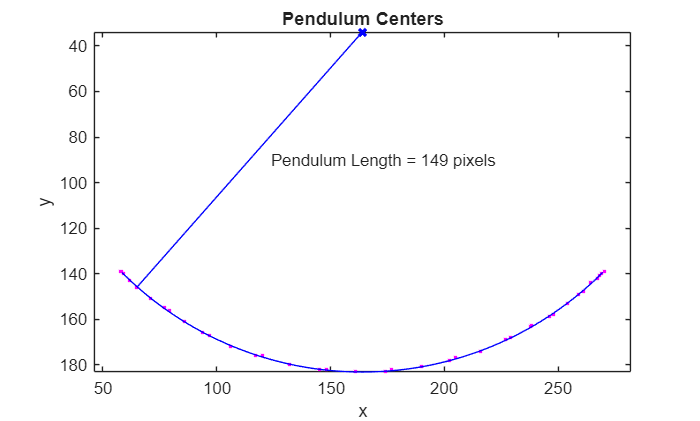
Use the fetchOutputs function to retrieve the results from the analyzeF future object. Calculate the pendulum length by fitting a circle through the pendulum centers and plot the results. For more details, see the calculateAndPlotLength function attached to this example as a supporting file.
allCentroids = fetchOutputs(analyzeF); calculateAndPlotLength(allCentroids);
Supporting Functions
displayOnClient
The displayOnClient function updates a figure plotting the detected pendulum centroids and updating the image frames. It appends the new centroid coordinates to the plot and refreshes the pendulum images with the latest input frame, region of interest (ROI), and processed frame.
function displayOnClient(p,himage,results) centroids = results.centroids; p.XData = [p.XData centroids(1)]; p.YData = [p.YData centroids(2)];
himage(1).CData = results.inputFrame; himage(2).CData = results.roi; himage(3).CData = results.processedFrame; drawnow limitrate nocallbacks; end
prepareDisplay
The prepareDisplay function sets up a figure window with a tiled layout to display images and plots related to pendulum tracking. The function creates a plot for tracking pendulum centers and initializes image placeholders for displaying various stages of image processing.
function [fig,p,himage] = prepareDisplay fig = figure(Name="Images from Camera",Visible="off"); tiledlayout(fig,3,3) nexttile(4,[2 3]) p = plot(NaN,NaN,"m."); axis ij; axis equal; xlabel("x"); ylabel("y"); title("Pendulum Centers");
himage = gobjects(1,3); titleStr = ["Pendulum Simulation","Cropped Region","Segmented Pendulum"]; for n = 1:3 nexttile(n) himage(n) = imshow(rand(480,640)); title(titleStr(n)) end end