Plot Simulation Data in Different Units - MATLAB & Simulink (original) (raw)
Main Content
When you display logged simulation data in Simscape™ Results Explorer, the data along the _x_-axis is always time, in seconds. However, you can change the _y_-axis units directly on the plot.
Each of the plots has a drop-down arrow next to the unit name for the_y_-axis. When you click this arrow, a context menu appears containing names of all the units in the unit registry that are commensurate with the current plot unit, as well as two other options:
Default— Use the default unit.Specify— Type the unit name or expression in a pop-up window and click OK. The specified unit name or expression must be commensurate with the current plot unit.
Once you select the option you want, the drop-down menu collapses and the plot is redrawn in specified units.
This example shows how you can plot the data in different units by selecting the unit interactively in the plot pane.
- Open the Permanent Magnet DC Motor example model. At the MATLAB® command prompt, enter:
openExample('simscape/PermanentMagnetDCMotorExample')
This example model has data logging enabled for the whole model, with theWorkspace variable name parameter set tosimlog_PermanentMagnetDCMotor.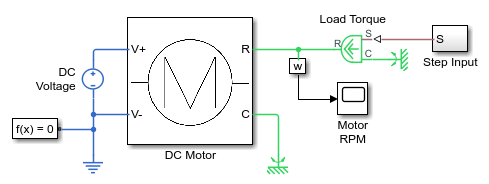
- Simulate the model to log the simulation data.
- Open the Simscape Results Explorer window and plot the rotational velocity of the Inertia block:
sscexplore(simlog_PermanentMagnetDCMotor,'DC_Motor.Inertia.w')
By default, Simscape Results Explorer plots rotational velocity in rad/s. - To plot data in different units, click the arrow under the unit name and then, from the context menu, select
rpm.
The rotational velocity plot is redrawn in rpm.