Simulink Editor - Create models and set model properties - MATLAB (original) (raw)
Create models and set model properties
Description
The Simulink® Editor allows you to create and configure system models.
The Simulink Editor is a tool for building models. In addition to providing standard methods for working with diagrams in a vector graphics editor, the editor provides shortcuts that help you to add and connect blocks. The Simulink Editor also gives you access to the tools you need for technical operations such as importing data, simulating your model, and analyzing model performance.

Open the Simulink Editor
- Create a model. On the MATLAB® Home tab, click Simulink and choose a model template.
Alternatively, if you already have the Library Browser open, click the New Model button .
. - Open an existing model. To open recent models, on the MATLABHome tab, click Simulink.
Alternatively, if a model is on the MATLAB path, enter the model name in the MATLAB Command Window. For example, suppose you want to openmyModel.slx. To open the model, in the command window, entermyModel.
Tip
The first model that you open in a MATLAB session takes longer to open than subsequent models. By default, MATLAB does not start Simulink until you open the first model to reduce MATLAB startup time and avoid unnecessary system memory use.
To speed up opening the first model, you can configure MATLAB startup to also start Simulink. For more information on how to start Simulink without opening models or the Library Browser, see the start_simulink reference page.
Examples
When you build a model in the Simulink Editor, you use common techniques for working with graphics objects.
Actions you can perform in the Simulink Editor include:
- Selecting using click, shift-click, and dragging
- Resizing objects using handles and moving objects by dragging
- Cutting, copying, and pasting
- Undoing and redoing up to 101 operations
Note
After you undo or redo block parameter changes, a visual cue appears that shows the current values of the affected parameters. Some parameter changes are not affected by the undo or redo commands. After you undo or redo changes to block parameters, use the cue to see the parameters affected.
A small subset of parameters cannot be undone. Changing these parameters clears the undo history when you make the change in the Property Inspector or in the block dialog box.
You can also zoom and scroll the editing area. On the Modeling tab, select Environment > Zoom, and select the zoom or view you want to use. If you are using a supported touch display platform, you can pinch to zoom and swipe to scroll. The supported touch display devices include Microsoft® Windows® platforms with a Windows 7 certified or Windows 8 certified touch display and Macintosh platforms with an Apple Magic Trackpad.
The editor supports additional shortcuts for scrolling that are unique to Simulink. Shortcuts and other interactive model building techniques are summarized in Keyboard Shortcuts and Mouse Actions for Simulink Modeling.
The Simulink Editor can provide you with visual cues for some model design issues. Highlighted blocks alert you to issues. To see a description of the issue, pause on a highlighted block and click the error or warning symbol.

Similar to the Diagnostic Viewer, if an error or warning has a predefined fix, the notification dialog box lists actions and may include a Fix button to apply these changes.
Simulink can detect block errors and warnings, such as:
- Goto and From block mismatches.
- Duplicate data store blocks. The value of the Duplicate data store names parameter determines whether to display a warning or an error symbol.
The Errors and Warnings option is enabled by default. To turn off this option, in the Debug tab, select Diagnostics > Edit-Time Errors & Warnings.
Use the Model Browser to navigate a model hierarchy using a tree structure. The browser helps you to understand the organization of your model and explore systems within systems.
To display the Model Browser, in the Simulink Editor, in the Modeling tab, select Environment > Model Browser. You can toggle the Model Browser display by clicking theHide/Show Model Browser control ![]() .
.

In the Model Browser, you can specify whether to display blocks that are linked to a library or to masked subsystems. Click  and select Library Links orSystems with Mask Parameters. For information on these types of blocks, see Linked Blocks and Masking Fundamentals.
As you build a model, you can set parameters and properties on model elements. For example, you can set parameters and properties for blocks that affect how the block functions. You can also set properties on Stateflow® charts, signal lines, visual elements such as annotations, and on the model.
Based on your workflow and goals, set parameters and properties using:
- The Property Inspector, which stays open in the editor as you work and updates based on the current selection
- A dialog box that is associated with an element, such as a specific block
- The Model Data Editor, which stays open and displays information about signals, states, and algorithmic block parameters (for instances, gains and filter coefficients) in a table
For blocks whose parameter value appears on the block icon, you can select the block, pause on the value, and edit the value directly. For more information, see Edit Block Parameters.
Related Examples
Parameters
To support common user workflow tasks, tabs called Simulation,Debug, Modeling,Format, and Apps provide functionality corresponding to each task.
The Apps tab provides a gallery of applications from the Simulink family of products. Apps may open a new contextual tab, a separate window, or they may be a shortcut to the configuration parameters.
After you open a gallery, you can mark buttons as favorites. Buttons that are favorites appear at the top of the gallery for quicker access. You can drag these buttons to reorder them.
When you select a model component, a contextual tab displays tools to assist you. For example, when you select a Subsystem block, the Subsystem Block tab appears. If you select a Stateflow chart, the State Chart tab appears. When the block or chart is no longer selected, the contextual tabs disappear.
The preferences folder saves the product-specific tabs that you have open for a model. Open tabs that require a license checkout do not persist after you close the model.
To add custom tabs to the Simulink Toolstrip, see Create Custom Simulink Toolstrip Tabs.
The quick access toolbar contains frequently used options such as save, undo, and redo. To customize the quick access toolbar, see Access Frequently Used Features and Commands in Simulink.
Commands also appear on context menus. Context menus appear when you right-click a model element or a blank area of the editor. For example, if you right-click a block, the menus display the commands relevant for working on blocks, such as clipboard and alignment operations. Some commands appear only on a context menu.
The palette along the left side of the editor provides shortcuts to commands you can use to modify the model appearance and navigate the model. For example, the palette includes a shortcut for adding annotations and other visuals, like boxed-in areas for labeling the model. It also provides a zoom button for zooming on a particular part of the model.
The Hide/Show Explorer Bar button in the upper left corner of the editor window displays a bar that shows where you are in the model hierarchy.
The Hide/Show Model Browser button displays theModel Browser pane. You can use this pane to view and navigate a hierarchical view of the model.
The icon in the lower-right corner opens additional views of the model. One such view is the Component Interface View, which helps you to trace usage of elements at component interfaces. Click the control to see these views.
A badge in the lower-left corner indicates that a model has external data sources, such as a data dictionary, or that there is data in the model workspace. Click the badge, then use the menu to navigate to these data sources.
- To open the Model Explorer with the Model Workspace node selected, click the Model Workspace link.
- To open the Model Explorer with the External Data node for the model selected, click the External Data link.
- To add or change a linked data dictionary, click the gear icon to open theExternal Data tab of the Model Properties dialog box.
Programmatic Use
simulink opens the Simulink Start Page. Select a model or template to open the Simulink Editor.
Version History
Introduced before R2006a
The Simulink Toolstrip contains components that were previously available in menus and toolbars. To support common user workflow tasks, new tabs calledSimulation, Debug,Modeling, Format, andApps provide functionality corresponding to each task.

The Apps tab provides a gallery of applications from the Simulink family of products. Apps may open a new contextual tab, a separate window, or they may be a shortcut to the configuration parameters.
When you select a model component, a contextual tab activates, displaying the tools to assist you in a step in your workflow. For example, when you select a subsystem block, theSubsystem tab appears. If you select a Stateflow chart, the State Chart tab appears. When the block or chart is no longer selected, the contextual tabs disappear.

The quick access toolbar contains frequently used options such as save, undo, and redo.

After opening a gallery, you can mark buttons as favorites. Buttons that are favorites appear at the top of the gallery for quicker access.

The following tables list the new Simulink Toolstrip items that are different from the Simulink Editor menu bar items. Many of the features and options that were previously hidden within the toolbar menus are now directly available from tabs on the Simulink Toolstrip.
File Menu
| Menu Bar Item | Toolstrip Equivalent |
|---|---|
| New > Blank Model (Ctrl+N)Model Chart Library Project Architecture | Simulation > New > Blank Model (Ctrl+N)Model Chart Library Project Architecture |
| Open (Ctrl+O) | Simulation > Open (Ctrl+O) |
| Open Recent | Simulation > Open > Recent Files. |
| Save (Ctrl+S) | Simulation > Save (Ctrl+S) |
| Save as | Simulation > Save > Save as |
| Project > Create Project from Model | Simulation > New > Project > New Project from this Model |
| Project > Find Dependencies Add to Project Remove from Project Get File Lock Discard Local Changes and Release Locks Compare to Ancestor Compare to Revision | Open your project. Simulation > Project > Run Dependency AnalysisMATLAB desktop > Add Files Remove Model From Project Get File Lock Discard Local Changes and Release Locks Compare to Ancestor Compare to Revision |
| Export Model to > Web Previous Version Protected Model Template Architecture Model | Simulation > Save > Web View Previous Version Protected Model Template Architecture Model |
| Reports > System Design Description | Modeling > Design Gallery > System Design Report |
| Reports > System Requirements | Apps > Requirements Manager > Share > Generate Model Traceability Report |
| Model Properties > Model Properties | Modeling > Model Settings > Model Properties |
| Model Properties > Link to Data Dictionary | Modeling > Design Gallery > Link to Data Dictionary |
| Model Properties > Chart Properties State Machine Properties | Open your Stateflow chart. Modeling > Chart Properties > Chart Properties Machine Properties |
| Link to Data Dictionary | Modeling > Model Settings > Model Properties > Data tab |
| Print > Print Print to File Print Details Page Setup Enable Tiled Printing Show Page Boundaries | Simulation > Print > PrintClick Print. Select the Print To File check box.Print Details Page Setup Enable Tiled Printing Show Page Boundaries |
| Simulink Preferences | Modeling > Environment > Simulink Preferences |
| Stateflow Preferences > Style Syntax Highlighting | Open your Stateflow chart. Format > Style > Style Syntax Highlighting |
| Exit MATLAB (Ctrl+Q) | Exit MATLAB from MATLAB |
Edit Menu
| Menu Bar Item | Toolstrip Equivalent |
|---|---|
| Undo (Ctrl+Z) | (Ctrl+Z) |
| Redo (Ctrl+Y) | (Ctrl+Y) |
| Cut (Ctrl+X) | (Ctrl+X) |
| Copy (Ctrl+C) | (Ctrl+C) |
| Copy Current View to Clipboard > Metafile Bitmap | Format > Screenshot  > Use Windows Metafile Format (.wmf) Use Bitmap Format (.bmp) > Use Windows Metafile Format (.wmf) Use Bitmap Format (.bmp) |
| Paste (Ctrl+V) | (Ctrl+V) |
| Paste Duplicate Inport | Right-click. Paste Duplicate Inport |
| Select All (Ctrl+A) | (Ctrl+A) |
| Comment Through (Ctrl+Shift+Y) | Debug > Comment Through  (Ctrl+Shift+Y) (Ctrl+Shift+Y) |
| Comment Out (Ctrl+Shift+X) | Debug > Comment Out  (Ctrl+Shift+X) (Ctrl+Shift+X) |
| Delete | Use the Delete key. |
| Find | Modeling > Find  |
| Find Referenced Variables | Modeling > Find > Find Ref Variables |
| Find & Replace in Chart | Open your Stateflow chart. Modeling > Find > Find & Replace in Chart |
| Bus Editor | Modeling > Design Gallery > Bus Editor |
| Lookup Table Editor | Modeling > Design Gallery > Lookup Table Editor |
View Menu
| Menu Bar Item | Toolstrip Equivalent |
|---|---|
| Library Browser | Simulation > Library Browser  |
| Model Explorer > Model Explorer | Modeling > Design Gallery > Model Explorer |
| Model Explorer > Base Workspace Data Dictionary Model Workspace | Modeling > Design Gallery > Base Workspace Data Dictionary Model Workspace |
| Variant Manager | Modeling > Design Gallery > Variant Manager |
| Project | Open your project. Simulation > Project > View Project |
| Model Dependency Viewer > Models & Libraries Models Only Referenced Model Instances | Modeling > Design > Model Dependencies > Models & Libraries Models Only Referenced Model Instances |
| Diagnostic Viewer | Debug > Diagnostics > Diagnostic Viewer  |
| Schedule Editor | Modeling > Design Gallery > Schedule Editor |
| Requirements at This Level Link to Selection in MATLAB Link to Current Test Case Link to Selection in Word Link to Selection in Excel Select for Linking with Simulink Add Link to Selected Object(s) Open Outgoing Links dialog Copy URL to Clipboard | Right-click the canvas. Requirements at This Level > Link to Selection in MATLAB Link to Current Test Case Link to Selection in Word Link to Selection in Excel Select for Linking with Simulink Add Link to Selected Object(s) Open Outgoing Links dialog Copy URL to Clipboard |
| Model Browser > Show Model Browser | Modeling > Environment > Model Browser |
| Model Browser > Include Referenced Models Include Library Links Include Systems with Mask Parameters | Modeling > Environment > Model Browser > 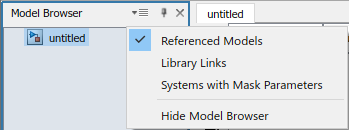 |
| Property Inspector | Modeling > Design Gallery > Property Inspector (Ctrl+Shift+I) |
| Notes | Modeling > Design Gallery > Notes (Ctrl+Shift+N) |
| Model Data Editor | Modeling > Design Gallery > Model Data Editor (Ctrl+Shift+E) |
| Viewmarks > Viewmark This View | Simulation > Save > Save Viewmark |
| Viewmarks > Show Viewmarks | Simulation > Open > Open Viewmarks |
| Configure Toolbars | Modeling > Environment > Simulink Preferences |
| Toolbars | Modeling > Environment > Toolstrip |
| Status Bar | Modeling > Environment > Status Bar |
| Explorer Bar | Modeling > Environment > Explorer Bar |
| Navigate > Back Forward Up to Parent | Use the navigation arrows  in the top left of the Simulink Editor. in the top left of the Simulink Editor. |
| Navigate > Previous Tab | (Ctrl+Shift+Backtab) |
| Navigate > Next Tab | (Ctrl+Tab) |
| Zoom > Zoom In Zoom Out Normal View (100%) Fit to View | Modeling > Environment> Zoom > Zoom In (Ctrl++)Zoom Out (Ctrl+-)Normal View (100%) ( Alt+1)Fit to View (Spacebar) |
| Smart Guides | Modeling > Environment > Smart Guides |
Display Menu
| Menu Bar Item | Toolstrip Equivalent |
|---|---|
| Interface | Modeling > Design Gallery > Model Interface |
| Library Links > None Disabled User Defined All | Debug > Information Overlays  > Hide All Links > Hide All Links  Disabled Links Disabled Links  User-Defined Links User-Defined Links  Show All Links Show All Links  |
| Sample Time > All Annotations Colors Off Timing Legend | Debug > Information Overlays > Colors  Text Text  Legend Legend  |
| Function Connectors | Debug > Information Overlays > Function Connectors  |
| Blocks > Block I/O Mismatch for Referenced Models Block Version for Referenced Models Sorted Execution Order Variant Conditions Variant Condition Legend | Debug > Information Overlays > Ref. Model I/O Mismatch  Ref. Model Version Ref. Model Version  Execution Order Execution Order  Variant Conditions Variant Conditions  Variant Legend Variant Legend  |
| Blocks > Tool Tip Options > Block Name Parameter Names & Values Description Variant Condition | Debug > Information Overlays > Name in Tooltip  Parameters in Tooltip Description in Tooltip Variant Conditions Parameters in Tooltip Description in Tooltip Variant Conditions |
| Errors & Warnings | Debug > Diagnostics > Edit-Time Errors & Warnings |
| Signals & Ports > Signal Dimensions Wide Nonscalar Lines Port Data Types Port Data Type Display Format > Alias Type, Base Type, Base and Alias Types Port Units Propagated Signal Labels Design Ranges Signal to Object Resolution Indicator Execution Context Indicator Storage Class Testpoint & Logging Indicators Viewer Indicator Linearization Indicators Hidden Rate Transition Block Indicators | Debug > Information Overlays > Signal Dimensions  Nonscalar Signals Nonscalar Signals  Base Data Types Base Data Types  Alias Data Types Units Alias Data Types Units  Propagated Signal Labels Propagated Signal Labels  Signal Data Ranges Signal Data Ranges  Signal Resolves to Object Signal Resolves to Object  Execution Context Execution Context  Storage Class Storage Class  Log & Testpoint Log & Testpoint  Viewers Viewers  Linearization Indicators Linearization Indicators  Automatic Rate Transitions Automatic Rate Transitions |
| Simscape > Domain Styles Legend | Debug > Information Overlays > Simscape Domains  Simscape Legends Simscape Legends  |
| Simscape > Toggle Sparklines When Clicked Remove All Sparklines | Debug > Output Values > Enable Sparkline Plots Remove Sparklines |
| Data Display in Simulation > Remove All Value Labels Show Value Label of Selected Port Show Value Labels When Hovering Toggle Value Labels When Clicked Options | Debug > Output Values > Remove Value Displays  Show Output Value of selected signal Show Output Value of selected signal  Options > Show When Hovering check boxToggle Value Displays Options Options > Show When Hovering check boxToggle Value Displays Options  |
| Stateflow Animation | See Stateflow Release Notes. |
| Highlight Signal to Source | Debug > Trace Signal > Trace to Source  |
| Highlight Signal to Destination | Debug > Trace Signal > Trace to Destination  |
| Remove Highlighting | Debug > Trace Signal > Remove trace  |
| Hide Automatic Names | Select the block(s). Block > Name  > Auto On Off Hide Automatic Block Names > Auto On Off Hide Automatic Block Names |
| Hide Markup | Format > Show Markup  |
Diagram Menu
| Menu Bar Item | Toolstrip Equivalent |
|---|---|
| Refresh Blocks | Modeling > Update Model > Refresh Blocks  (Ctrl+K) (Ctrl+K) |
| Subsystem & Model Reference > Create Subsystem from Selection | Select the blocks to create a subsystem. Multiple > Create Gallery > Create Subsystem |
| Subsystem & Model Reference > Expand Subsystem | Select the subsystem. Subsystem > Expand  |
| Subsystem & Model Reference > Convert to > Referenced Model Variant Subsystem | Select the subsystem. Subsystem > Convert > Convert to Model Block Convert to Variant |
| Subsystem & Model Reference > Model Block Normal Mode Visibility | Simulation > Prepare Gallery > Normal Mode Visibility |
| Subsystem & Model Reference > Refresh Selected Model Block | Select the Model block. Model Block > Refresh |
| Subsystem & Model Reference > Create Protected Model for Selected Model Block | Select the Model block. Model Block > Protect |
| Format > Font Style | Format |
| Format > Text Alignment | Double-click the text. Use the pop-up menu. |
| Format > Enable TeX Commands Foreground Color Background Color Connector Width Shadow Show Block Name Content Preview Port Labels Canvas Color | Format > Enable Equations  Select block. ForegroundSelect block. BackgroundClick the text. Connector > Line WidthSelect block. Shadow Select block. ForegroundSelect block. BackgroundClick the text. Connector > Line WidthSelect block. Shadow  Name Select block. Content Preview Name Select block. Content Preview  Select block. Port Labels Select block. Port Labels  Click the canvas. Background Click the canvas. Background |
| Rotate & Flip > Clockwise Counterclockwise Flip Block Flip Block Name | Select the block. Format > Rotate 90 clockwise  Rotate 90 counterclockwise Rotate 90 counterclockwise  Flip left-right Flip left-right  Flip up-down Flip up-down  Flip Name Flip Name  |
| Arrange > Arrange Automatically Align Distribute Match Bring to Front Send to Back | Format > Auto Arrange  Select blocks. Align Select blocks. Align  Select blocks. Distribute Select blocks. Distribute  Select blocks. Match Select blocks. Match  Bring to Front Bring to Front  Send to Back Send to Back  |
| Mask > Create Mask Add Icon Image Mask Parameters Look Under Mask | Select the block. Block > Create Mask Add Image Mask Parameters Look Under Mask |
| Mask > Create Model Mask | Modeling > Component Gallery > Create Model Mask |
| Library Link > Go To Library Block Disable Link Resolve Link View Changes | Select a library linked block. Subsystem > Go to Library Disable Link Restore Link View Changes |
| Signal & Ports > Signal & Scope Manager Viewers | Simulation > Prepare Gallery apps |
| Signals & Ports > Input Port Signal Properties Output Port Signal Properties | Right-click block. Signals & Ports > Input Port Signal Properties Output Port Signal Properties |
| Signal & Ports > Signal Hierarchy | Click signal. Signal > Signal Hierarchy |
| Block Parameters | Right-click block. Block Parameters |
| Properties | Right-click block. Properties |
Simulation Menu
| Menu Bar Item | Toolstrip Equivalent |
|---|---|
| Update Diagram | Modeling > Update Model (Ctrl+D) |
| Model Configuration Parameters | Modeling > Model Settings |
| Mode > Normal Accelerator Rapid Accelerator | Simulate > Normal Accelerator Rapid Accelerator |
| Mode > Software-in-the-Loop (SIL) Processor-in-the-Loop (PIL) | Apps > SIL/PIL Manager > SIL/PIL SIL/PIL Mode > **Software-in-the-Loop (SIL)**SIL/PIL Mode > Processor-in-the-Loop (PIL) |
| Mode > External | A Hardware tab will appear to the left of theApps tab for all models configured to run on hardware. To configure your system to be run on hardware, in the Modeling tab, click Model Settings. In the Hardware Implementation pane of the Configuration Parameters, choose your hardware board from the dropdown list. Once your hardware board is selected, open the Target hardware resources options and under Groups chooseExternal Mode. |
| Data Display > Remove All Value Labels Show Value Label of Selected Port Show Value Labels When Hovering Toggle Value Labels When Clicked Options | Debug > Output Values > Remove Value Displays Show Output Value of selected signal Options > Show When Hovering check boxToggle Value Displays Options |
| Stateflow Animation > Lightning Fast Fast Medium Slow None Maintain Highlighting | Open your Stateflow chart. Debug > Animation Speed > Lightning Fast Fast Medium Slow None Highlighting  |
| Fast Restart | Simulation > Fast Restart  |
| Step Back | Simulation > Step Back  |
| Run | Simulation > Run  |
| Pacing Options | Simulation > Run > Simulation Pacing  |
| Step Forward | Simulation > Step Forward  |
| Stop | Simulation > Stop  |
| Output > Simulation Data Inspector Logic Analyzer Bird's-Eye Scope | Simulation > Review Results Gallery > Data Inspector Logic Analyzer Bird's-Eye Scope |
| Output > Log Selected Signals Log Chart Signals Configure Logging | Simulation > Prepare Gallery Log SignalsIn R2019b, the Stateflow Signal Logging dialog box is no longer available. To log multiple signals from your Stateflow chart, see the Stateflow release notes.Configure Logging |
| Stepping Options > | Simulation > Step Back > Configure simulation stepping  |
| Debug > Add Conditional Breakpoint Conditional Breakpoints List Debug Model | Debug > Add Breakpoint  Breakpoints List Breakpoints List  Breakpoints List > Debug Model Breakpoints List > Debug Model  |
| Debug > Stateflow Breakpoints and Watch Window | Open your Stateflow chart. Debug > Breakpoints List  |
| Debug > Simulation Target for MATLAB and Stateflow | Modeling > Model Settings > Simulation Target |
| Debug > Set Stateflow Breakpoints Clear Stateflow Breakpoints | Open your Stateflow chart. Debug > Add Breakpoint  Breakpoints List > Clear Breakpoints Breakpoints List > Clear Breakpoints |
| Debug > MATLAB and Stateflow Error Checking Options > Detect Cycles | Debug > Diagnostics > Detect Cyclical Behavior |
Analysis Menu
| Menu Bar Item | Toolstrip Equivalent |
|---|---|
| Model Advisor > Display Advisor Checks in Editor Model Advisor Model Advisor Dashboard Configure Advisor Edit-Time Checks Preferences Upgrade Advisor | Modeling > Model Advisor  > Edit-Time Checks Model Advisor Model Advisor Dashboard > Edit-Time Checks Model Advisor Model Advisor Dashboard  Customize Edit-Time Checks Customize Edit-Time Checks  Preferences Preferences  Upgrade Advisor Upgrade Advisor  |
| Metrics Dashboard | Apps > Metrics Dashboard |
| Refactor Model > Identify Modeling Clones Model Transformer | Apps > Clone Detector Model Transformer |
| Refactor Model > Model Transformer | Apps > Model Transformer |
| Model Slicer | Apps > Model Slicer |
| Model Dependencies > Model Dependency Viewer > Models & Libraries Models Only Referenced Model Instances | Modeling > Design Gallery > Model Dependencies |
| Model Dependencies Generate Manifest Edit Manifest Contents Compare Manifests Export Files in Manifest | Modeling > Compare  > Manifest > Manifest  > Generate Manifest Edit Manifest Compare Manifests Export Files in Manifest > Generate Manifest Edit Manifest Compare Manifests Export Files in Manifest |
| Compare To | Modeling > Compare > Compare Models |
| Simscape > Statistics Viewer Variable Viewer | Apps > Simscape Statistics Viewer Simscape Variable Viewer |
| Performance Tools > Show Profiler Report Performance Advisor Solver Profiler | Debug > Performance Advisor > Activate Profiler Performance Advisor Solver Profiler |
| Requirements > Requirements Perspective Requirements Editor Highlight Model | Apps > Requirements Manager > Requirements Requirements > Requirements Editor  Requirements > Highlight Links Requirements > Highlight Links  |
| Requirements > Reports > Check Consistency Generate Report Generate Web View | Apps > Requirements Manager > Check Consistency Share > Generate Model Traceability Report  Share > Export Model to Web View Share > Export Model to Web View  |
| Requirements > Requirements at This Level > Link to Selection in MATLAB Link to Current Test Case Link to Selection in Word Link to Selection in Excel Select for Linking with Simulink Add Link to Selected Object(s) Open Outgoing Links dialog Copy URL to Clipboard | Right-click the canvas. Requirements at This Level > Link to Selection in MATLAB Link to Current Test Case Link to Selection in Word Link to Selection in Excel Select for Linking with Simulink Add Link to Selected Object(s) Open Outgoing Links dialog Copy URL to Clipboard |
| Requirement > Links File > Load Links Save Links Copy to Model | Apps > Requirements Manager > Load Links  Save All > Save Links Only Links Settings > Save Links in Model File Save All > Save Links Only Links Settings > Save Links in Model File |
| Requirements > Settings | Apps > Requirements Viewer > Link Settings |
| Control Design > Steady State Manager Linear Analysis Frequency Response Estimation Control System Designer Control System Tuner Model Discretizer Linearize Block Specify Selected Block Linearization | Apps > Steady State Manager Model Linearizer Frequency Response Control System Designer Control System Tuner Model Discretizer Linearization Manager > Linearize Block Linearization Manager > Specify Block Linearization |
| Control Design > Linear Analysis Points > Open-loop Input Open-loop Output Loop Transfer Loop Break Input Perturbation Output Measurement Sensitivity Complementary Sensitivity Trim Output Constraint Help Me Select | Right-click signal. Apps > Linearization Manager > Open-loop Input Open-loop Output Loop Transfer Loop Break Input Perturbation Output Measurement Sensitivity Complementary Sensitivity Trim Output Constraint Help with Selecting Analysis Point |
| Parameter Estimation | Apps > Parameter Estimator |
| Response Optimization | Apps > Response Optimizer |
| Sensitivity Analysis | Apps > Sensitivity Analyzer |
| Test Harness > Create for Model Create for Selection Import for Model Import for Selection Manage Test Harnesses | Apps > Simulink Test > Add Test Harness  Import Test Harness Import Test Harness  Manage Test Harnesses Manage Test Harnesses  |
| Observers > Go to Observer Block Add Observer Here Add Observer Port Here | Right-click the canvas. Observers > Go to Observer Block Add Observer Here Add Observer Port Here |
| Test Manager | Apps > Simulink Test > Simulink Test Manager |
| Design Verifier Check Compatibility Detect Design Errors Generate Tests Prove Properties Results Options | Apps > Design Verifier > Check Compatibility  Toggle Mode to Design Error Detection Toggle Mode to Design Error Detection  . Click Detect Design Errors.Toggle Mode to Test Generation . Click Detect Design Errors.Toggle Mode to Test Generation  . Click Generate Tests.Toggle Mode to Property Proving . Click Generate Tests.Toggle Mode to Property Proving  . Click Prove Properties.Results Test Generation Settings > Settings . Click Prove Properties.Results Test Generation Settings > Settings |
| Design Verifier > Model Slicer | Apps > Model Slicer |
| Coverage > Open Results Explorer Open Results Explorer Settings | Apps > Coverage Analyzer > Results Explorer Settings |
| Data Type Design > Fixed-Point Tool Single Precision Converter Lookup Table Optimizer | Apps > Fixed-Point Tool Single Precision Converter Lookup Table Optimizer |
Code Menu
| Menu Bar Item | Toolstrip Equivalent |
|---|---|
| C/C++ Code > Code Generation Report > Open Model Report Open Subsystem Report Options | These options can be found by using Embedded Coder,Simulink Coder, or the AUTOSAR Component Designer. The path is shown using Embedded Coder. For Simulink Coder or AUTOSAR Component Designer, select those apps from theApps gallery.Apps > Embedded Coder > C Code > View Code  Open Latest Report Open Latest Report  Open Latest Report > Report Options Open Latest Report > Report Options  |
| C/C++ Code > Embedded Coder Quick Start Code Generation Advisor Code Generation Options Configure Model in Code Perspective Build Model Embedded Coder Dictionary Navigate to C/C++ Code | These options can be found by using Embedded Coder,Simulink Coder, or the AUTOSAR Component Designer. The path is shown using Embedded Coder. For Simulink Coder or AUTOSAR Component Designer, select those apps from theApps gallery.Apps > Embedded Coder > C Code > Quick Start C/C++ Code Advisor Settings > Code Generation Settings Settings > Code Perspective Help check boxBuild  Settings > Embedded Coder Dictionary Settings > Embedded Coder Dictionary  (Embedded Coder only)View Code (Embedded Coder only)View Code |
| C/C++ Code > Build Selected Subsystem | Right-click the subsystem. C/C++ Code > Build This Subsystem |
| C/C++ Code > Export Functions Generate S-Function | Right-click the function or S-function. C/C++ Code > Export Functions Generate S-Function |
| HDL Code > Add HDL Coder Configuration to Model HDL Workflow Advisor Options Generate HDL Generate Test Bench Remove HDL Coder Configuration from Model | Apps > HDL Coder > HDL Code > Settings > Add HDL Configuration to Model Workflow Advisor  Settings > HDL Code Generation Settings Generate HDL Code Settings > HDL Code Generation Settings Generate HDL Code  Generate Test Bench Generate Test Bench  Settings > Remove HDL Configuration to Model Settings > Remove HDL Configuration to Model |
| PLC Code > Check Subsystem Compatibility Generate Code for Subsystem Generate and Import Code for Subsystem Generate, Import, and Verify Code for Subsystem Navigate to Code Options | Apps > PLC Coder > PLC Code > Check Compatibility Generate PLC Code Settings > Import Code into IDE Settings > Verify Code in IDE Navigate to Code Settings > PLC Code Generation Settings |
| Data Objects > Data Object Wizard Custom Storage Class Designer | Modeling > Design Gallery > Data Object Wizard Custom Storage Class Designer |
| External Mode Control Panel | Apps > Run on Custom Hardware > Hardware > Prepare Gallery > Control Panel |
| Simulink Code Inspector | Apps > Code Inspector |
| Verification Wizards > HDL Co-Simulation FPGA-in-the-Loop (FIL) | Apps > HDL Cosimulator FIL Wizard |
| Polyspace > Verify Code Generated for Annotate Selected Block Options Remove Options from Current Configuration Open Results Open Job Monitor Open Metrics | Apps > Polyspace Code Verifier > Analyze Code fromAdd Annotation Settings > Polyspace Settings Settings > Remove Polyspace Configuration from Model Review Results Gallery > Analysis Results Review Results Gallery > Remote Job Monitor Review Results Gallery > Code Quality Metrics |
| DO Qualification Kit > Artifacts Explorer Bug Reports Traceability Matrix | Apps > DO Qualification Kit > Artifacts Explorer  Bug Reports Bug Reports  Traceability Matrix Traceability Matrix  |
| DO Qualification Kit > Qualification Tests Polyspace Bug Finder Polyspace Code Prover Simulink Report Generator Simulink Model Comparison Simulink Check Simulink Code Inspector Simulink Coverage Simulink Design Verifier Test Requirements | Apps > DO Qualification Kit > Run Qualification Tests > Polyspace Bug Finder Polyspace Code Prover Simulink Report Generator Simulink Model Comparison Simulink Check Simulink Code Inspector Simulink Coverage Simulink Design Verifier Simulink Test Simulink Requirements > Polyspace Bug Finder Polyspace Code Prover Simulink Report Generator Simulink Model Comparison Simulink Check Simulink Code Inspector Simulink Coverage Simulink Design Verifier Simulink Test Simulink Requirements |
| IEC Certification Kit > Artifacts Explorer Bug Reports Traceability Matrix | Apps > IEC Certification Kit > Artifacts Explorer Bug Reports Traceability Matrix |
| IEC Certification Kit > Validation Tests > Polyspace Bug Finder Polyspace Code Prover Embedded Coder Simulink Check Simulink Coverage Simulink Design Verifier Simulink Test Simulink Requirements | Apps > IEC Certification Kit > Run Validation Tests > Polyspace Bug Finder Polyspace Code Prover Embedded Coder Simulink Check Simulink Coverage Simulink Design Verifier Simulink Test Simulink Requirements |
Tools Menu
| Menu Bar Item | Toolstrip Equivalent |
|---|---|
| Library Browser | Simulation > Library Browser |
| Model Explorer | Modeling > Design Gallery > Model Explorer |
| Report Generator | Apps > Report Generator |
| Requirements Editor | Apps > Requirements Manager > Requirements Editor |
| MPlay Video Viewer | Apps > Video Viewer |
| Robot Operating System > Configure Network Addresses Manage Array Sizes | Open your ROS model. Simulation > Prepare Gallery > ROS Network Variable Size Messages |
| Simulink Real-Time | Apps > Simulink Real-Time |
| Run on Target Hardware > Prepare to Run Install/Update Support Package | Apps > Run on Hardware Board Get Hardware Support Packages |
| SoC Builder | Open your SoC project. System on Chip > Configure, Build & Deploy |
| Help | Use the quick access toolbar |