Model Coverage for Stateflow Charts - MATLAB & Simulink (original) (raw)
A model coverage report is generated automatically if you simulate your model using the Run button. If you did not use the Run button, or you loaded coverage data without simulating the model, generate a Model Coverage report using cvhtml.
For Stateflow® charts, Simulink® Coverage™ records the execution of the chart itself and the execution of states, transition decisions, and individual conditions that compose each decision. Simulink Coverage also analyzes assignment statements that contain logical expressions. Logical expressions are expressions that contain a logical operator, such as the logicalAND (&&) or the logicalOR (||). Assignment statements can be anywhere in your chart, including state enter or exit actions, transition actions, and more.
Note
Model coverage only analyzes assignment statements that contain logical expressions, but code coverage analyzes all Boolean assignment statements. This difference can result in a discrepancy between model and code coverage results.
After simulation ends, Simulink Coverage reports on how thoroughly a model was tested. The report shows:
- How many times each exclusive sub-state is executed or exited from its parent superstate and entered due to parent superstate history. A sub-state is considered executed when its
duringaction is taken. - How many times each transition decision has been evaluated as true or false.
- How many times each condition has been evaluated as true or false.
Note
To measure model coverage data for a Stateflow chart, you must:
- Have a Stateflow license.
- Have debugging/animation enabled for the chart.
Specify Coverage Report Settings for Stateflow Charts
Specify coverage recording settings from the Coverage pane of the Configuration Parameters dialog box.
Enabling coverage analysis also enables the selection of different coverage metrics. The following sections address only coverage metrics that affect reports for Stateflow charts. These metrics include decision coverage, condition coverage, and MCDC coverage.
Model Coverage Reports for Stateflow Charts
- Summary Report Section
- Subsystem and Chart Details Report Sections
- State Details Report Section
- Transition Details Report Section
The following sections of a Model Coverage report were generated by simulating thesf_boiler model, which includes the Bang-Bang Controller chart. The coverage metrics for MCDC are enabled for this report. To open the model, in the MATLAB® command window, execute:
openExample("sf_boiler");
Summary Report Section
The Summary section shows coverage results for the entire test and appears at the beginning of the Model Coverage report.

Each line in the hierarchy summarizes the coverage results at that level and the levels below it. You can click a hyperlink to a later section in the report with the same assigned hierarchical order number that details that coverage and the coverage of its children.
The top level, sf_boiler, is the Simulink model itself. The second level, Bang-Bang Controller, is the Stateflow chart. The next levels are superstates within the chart, in order of hierarchical containment. Each superstate uses an SF: prefix. The bottom level, Boiler Plant model, is an additional subsystem in the model.
Subsystem and Chart Details Report Sections
When recording coverage for a Stateflow chart, the Simulink Coverage software reports two types of coverage for the chart—Subsystem and Chart.
- Subsystem — This section reports coverage for the chart:
- Coverage (this object): Coverage data for the chart as a container object
- Coverage (inc.) descendants: Coverage data for the chart and the states and transitions in the chart.
If you click the hyperlink of the subsystem name in the section title, the Bang-Bang Controller block is highlighted in the block diagram.
Decision coverage is not applicable (NA) because this chart does not have an explicit trigger. Condition coverage and MCDC are not applicable (NA) for a chart, but apply to its descendants.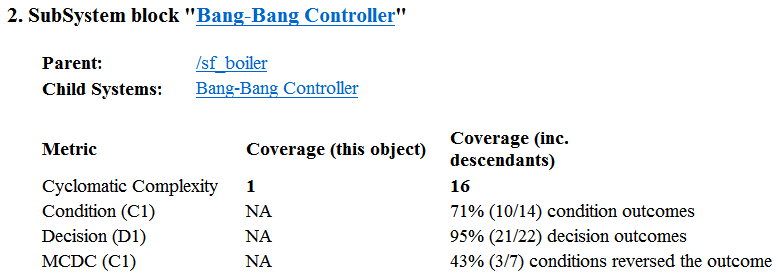
- Chart — This section reports coverage for the chart:
- Coverage (this object): Coverage data for the chart and its inputs
- Coverage (inc.) descendants: Coverage data for the chart and the states and transitions in the chart.
If you click the hyperlink of the chart name in the section title, the chart opens in the Stateflow Editor.
Decision coverage is listed appears for the chart and its descendants. Condition coverage and MCDC are not applicable (NA) for a chart, but apply to its descendants.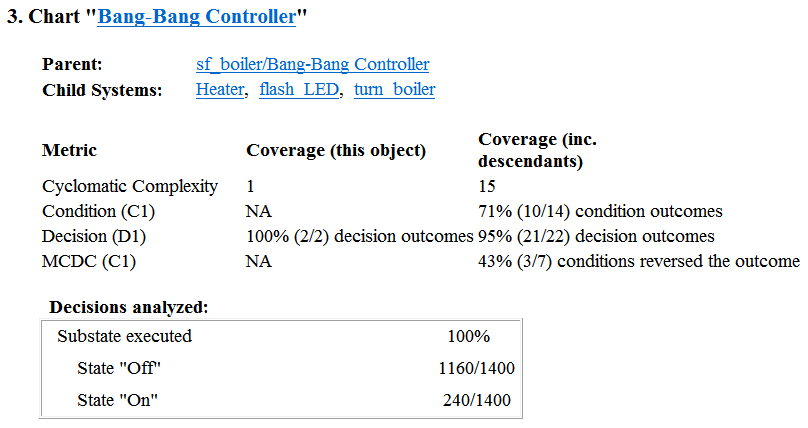
State Details Report Section
For each state in a chart, the coverage report includes a_State_ section with details about the coverage recorded for that state.
In the sf_boiler model, the state On resides in the box Heater. On is a superstate that contains:
- Two substates
HIGHandNORM - A history junction
- The function
warm

The coverage report includes a State section on the stateOn.
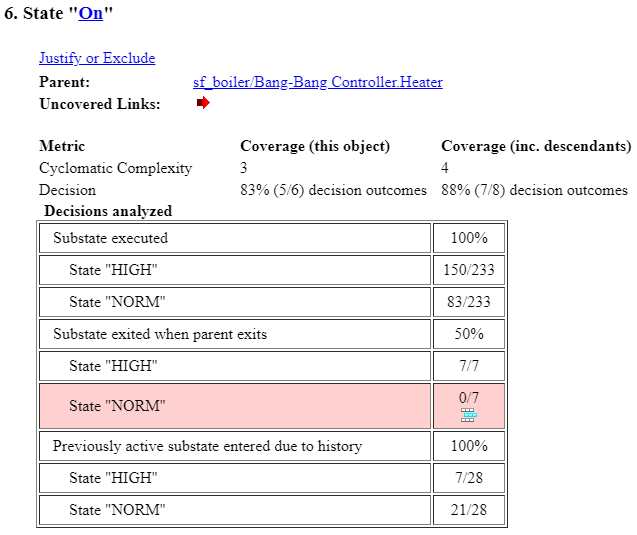
The decision coverage for the On state tests the decision of which substate to execute.
The three decisions are listed in the report:
- Under Substate executed, which substate to execute when
Onexecutes. - Under Substate exited when parent exited, which substate is active when
Onexits.NORMis listed as never being active whenOnexits because the coverage tool sees the supertransition fromNORMtoOffas a transition fromOntoOff. - Under Previously active substate entered due to history, which substate to reenter when
Onre-executes. The history junction records the previously active substate.
Because each decision can result in either HIGH orNORM, the total possible outcomes are 3 × 2 = 6. The results indicate that five of six possible outcomes were tested during simulation.
Cyclomatic complexity and decision coverage also apply to descendants of theOn state. The decision required by the condition[warm()] for the transition from HIGH to NORM brings the total possible decision outcomes to 8. Condition coverage and MCDC are not applicable (NA) for a state.
Note
Nodes and edges that make up the cyclomatic complexity calculation have no direct relationship with model objects (states, transitions, and so on). Instead, this calculation requires a graph representation of the equivalent control flow.
Transition Details Report Section
Reports for transitions appear under the report sections of their owning objects. Transitions do not appear in the model hierarchy of the Summary section, since the hierarchy is based on superstates that own other Stateflow objects.
![Coverage results for the "after(40,sec)[cold()]" transition report that the transition receives 67% condition coverage (4 out of 6 condition outcomes satisfied), 100% decision coverage (2 out of 2 decision outcomes satisfied), and 33% MCDC (1 out of 3 conditions independently affect the decision outcome).](https://in.mathworks.com/help/slcoverage/ug/model_coverage_transition.png)
The decision for this transition depends on the time delay of 40 seconds and the condition [cold()]. If, after a 40 second delay, the environment is cold (cold() = 1), the decision to execute this transition and turn the Heater on is made. For other time intervals or environment conditions, the decision is made not to execute.
For decision coverage, both true and false outcomes occurred. Because two of two decision outcomes occurred, coverage was full or 100%.
Condition coverage shows that only 4 of 6 condition outcomes were tested. The temporal logic statement after(40,sec) represents two conditions: the occurrence of sec and the time delayafter(40,sec). Therefore, three conditions on the transition exist: sec, after(40,sec), andcold(). Since each of these decisions can be true or false, six possible condition outcomes exist.
The Conditions analyzed table shows each condition as a row with the recorded number of occurrences for each outcome (true or false). Decision rows in which a possible outcome did not occur are shaded. For example, the first and the third rows did not record an occurrence of a false outcome.
In the MCDC report, all sets of occurrences of the transition conditions are scanned for a particular pair of decisions for each condition in which the following are true:
- The condition varies from true to false.
- All other conditions contributing to the decision outcome remain constant.
- The outcome of the decision varies from true to false, or the reverse.
For three conditions related by an implied AND operator, these criteria can be satisfied by the occurrence of these conditions.
| Condition Tested | True Outcome | False Outcome |
|---|---|---|
| 1 | TTT | Fxx |
| 2 | TTT | TFx |
| 3 | TTT | TTF |
Notice that in each line, the condition tested changes from true to false while the other condition remains constant. Irrelevant contributors are coded with an "x" (discussed below). If both outcomes occur during testing, coverage is complete (100%) for the condition tested.
The preceding report example shows coverage only for condition 2. The false outcomes required for conditions 1 and 3 did not occur, and are indicated by parentheses for both conditions. Therefore, condition rows 1 and 3 are shaded. While condition 2 has been tested, conditions 1 and 3 have not and MCDC is 33%.
For some decisions, the values of some conditions are irrelevant under certain circumstances. For example, in the decision [C1 & C2 & C3 | C4 & C5] the left side of the | is false if any one of the conditionsC1, C2, or C3 is false. The same applies to the right side result if either C4 or C5 is false. When searching for matching pairs that change the outcome of the decision by changing one condition, holding some of the remaining conditions constant is irrelevant. In these cases, the MCDC report marks these conditions with an "x" to indicate their irrelevance as a contributor to the result. These conditions appear as shown.

Consider the first matched pair. Since condition 1 is true in the True outcome column, it must be false in the matchingFalse outcome column. This makes the conditions C2 and C3 irrelevant for the false outcome since C1 & C2 & C3 is always false if C1 is false. Also, since the false outcome is required to evaluate to false, the evaluation of C4 & C5 must also be false. In this case, a match was found with C4 = F, making conditionC5 irrelevant.
Code Coverage for C/C++ code in Stateflow Charts
Simulink Coverage can record code coverage if your Stateflow chart contains custom C/C++ code. For more information, see Coverage for Custom C/C++ Code in Simulink Models.
Model Coverage for Stateflow State Transition Tables
State transition tables are an alternative way of expressing modal logic in Stateflow. Stateflow charts represent modal logic graphically, and state transition tables can represent equivalent modal logic in tabular form. For more information, seeState Transition Tables (Stateflow).
Coverage results for state transition tables are the same as coverage results for equivalent Stateflow charts. For example, consider the temporal logic expressionafter(4, tick) in the Mode Logic chart of theslvnvdemo_covfilt example model.

When using C as the action language in a chart or state transition table, theafter(4, tick) transition represents two conditions: the occurrence of tick and the time delay after(4, tick). Since the temporal event tick is never false, the first condition is not satisfiable, and you cannot achieve 100% condition and MCDC coverage for the transition after(4, tick).
When using MATLAB as the action language, the after(4, tick) transition represents a single decision, with no subcondition for the occurrence oftick. The chart or transition table only reports decision coverage.