Stateflow.op.OperatingPointData - Operating point information for chart data - MATLAB (original) (raw)
Operating point information for chart data
Description
A Stateflow.op.OperatingPointData object contains a snapshot of a data object in a Stateflow® chart during simulation.
Creation
When you save the final operating point for a Simulink® model, as described in Save Operating Points, you create a Stateflow.op.BlockOperatingPoint object for each Stateflow chart in the model. This object contains aStateflow.op.OperatingPointData object for each:
- Chart output data
- Chart, state, and function local data
- Persistent variable in a MATLAB® function or truth table
Access a Stateflow.op.OperatingPointData object by using the property that matches the name of the data in the parent Stateflow.op.BlockOperatingPoint orStateflow.op.OperatingPointContainer. For example, suppose thatop is the Stateflow.op.BlockOperatingPoint object for a chart. To access the Stateflow.op.OperatingPointData object for a chart output called output, enter:
Similarly, to access the Stateflow.op.OperatingPointData object for a persistent variable called persistentVar in the MATLAB function function, enter:
op.function.persistentVar
Properties
This property is read-only.
Description of the saved operating point, specified as a character vector.
Data Types: char
This property is read-only.
Type of data, specified as a character vector. For more information, see Type.
Data Types: char
This property is read-only.
Size of the data, specified as a character vector. For more information, see Size.
Data Types: char
This property is read-only.
Range of acceptable values for the data, specified as a structure with fieldsMinimum and Maximum. For more information, seeLimit range.
Data Types: struct
This property is read-only.
Initial value of data, specified as a value of the type determined byDataType. For more information, see Initial value.
Value of data, specified as a value of the type determined byDataType.
Object Functions
| open | Display object in editing environment |
|---|
Examples
- Open the model
old_sf_car.
openExample("old_sf_car") - Set the model to save the final operating point. Open the Configuration Parameters dialog box and, in the Data Import/Export pane:
- Select Final states and enter a name for the operating point. For this example, use
xSteadyState. - Select Save final operating point.
- Click OK.
- Select Final states and enter a name for the operating point. For this example, use
- Set the stop time for this simulation segment. In the Simulation tab, set Stop Time to
10. - Run the simulation.
- Access the
Stateflow.op.BlockOperatingPointobject that contains the operating point information for theshift_logicchart.
blockpath = "old_sf_car/shift_logic";
op = get(xSteadyState,blockpath)
op =
Block: "shift_logic" (handle) (active)
Path: old_sf_car/shift_logic
Contains:- gear_state "State (AND)" (active)
- selection_state "State (AND)" (active)
gear "Block output data" double [1, 1]
- Highlight the states that are active in the chart at t = 10.
highlightActiveStates(op)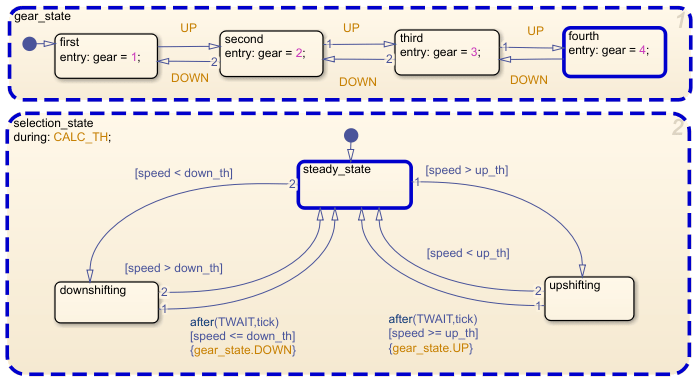
- Access the
Stateflow.op.OperatingPointDataobject that contains the operating point information for the chart outputgear.
ans =
Description: 'Block output data'
DataType: 'double'
Size: '[1, 1]'
Range: [1x1 struct]
InitialValue: [1x0 double]
Value: 4 - Change the value of
gearto1. - Inspect the modified operating point information for the chart output
gear.
ans =
Description: 'Block output data'
DataType: 'double'
Size: '[1, 1]'
Range: [1x1 struct]
InitialValue: [1x0 double]
Value: 1
Version History
Introduced in R2009b
Stateflow.SimState.SimStateData is now calledStateflow.op.OperationPointData. The behavior remains the same.
See Also
Objects
- Stateflow.op.BlockOperatingPoint | Stateflow.op.OperatingPointContainer | Simulink.op.ModelOperatingPoint (Simulink)