View aggregated data from the Overview (original) (raw)
After connecting your data sources to Microsoft Sentinel, use the Overview page to view, monitor, and analyze activities across your environment. This article describes the widgets and graphs available on Microsoft Sentinel's Overview dashboard.
Prerequisites
- Make sure that you have reader access to Microsoft Sentinel resources. For more information, see Roles and permissions in Microsoft Sentinel.
Access the Overview page
If your workspace is onboarded to the Microsoft Defender portal, select General > Overview. Otherwise, select Overview directly. For example:
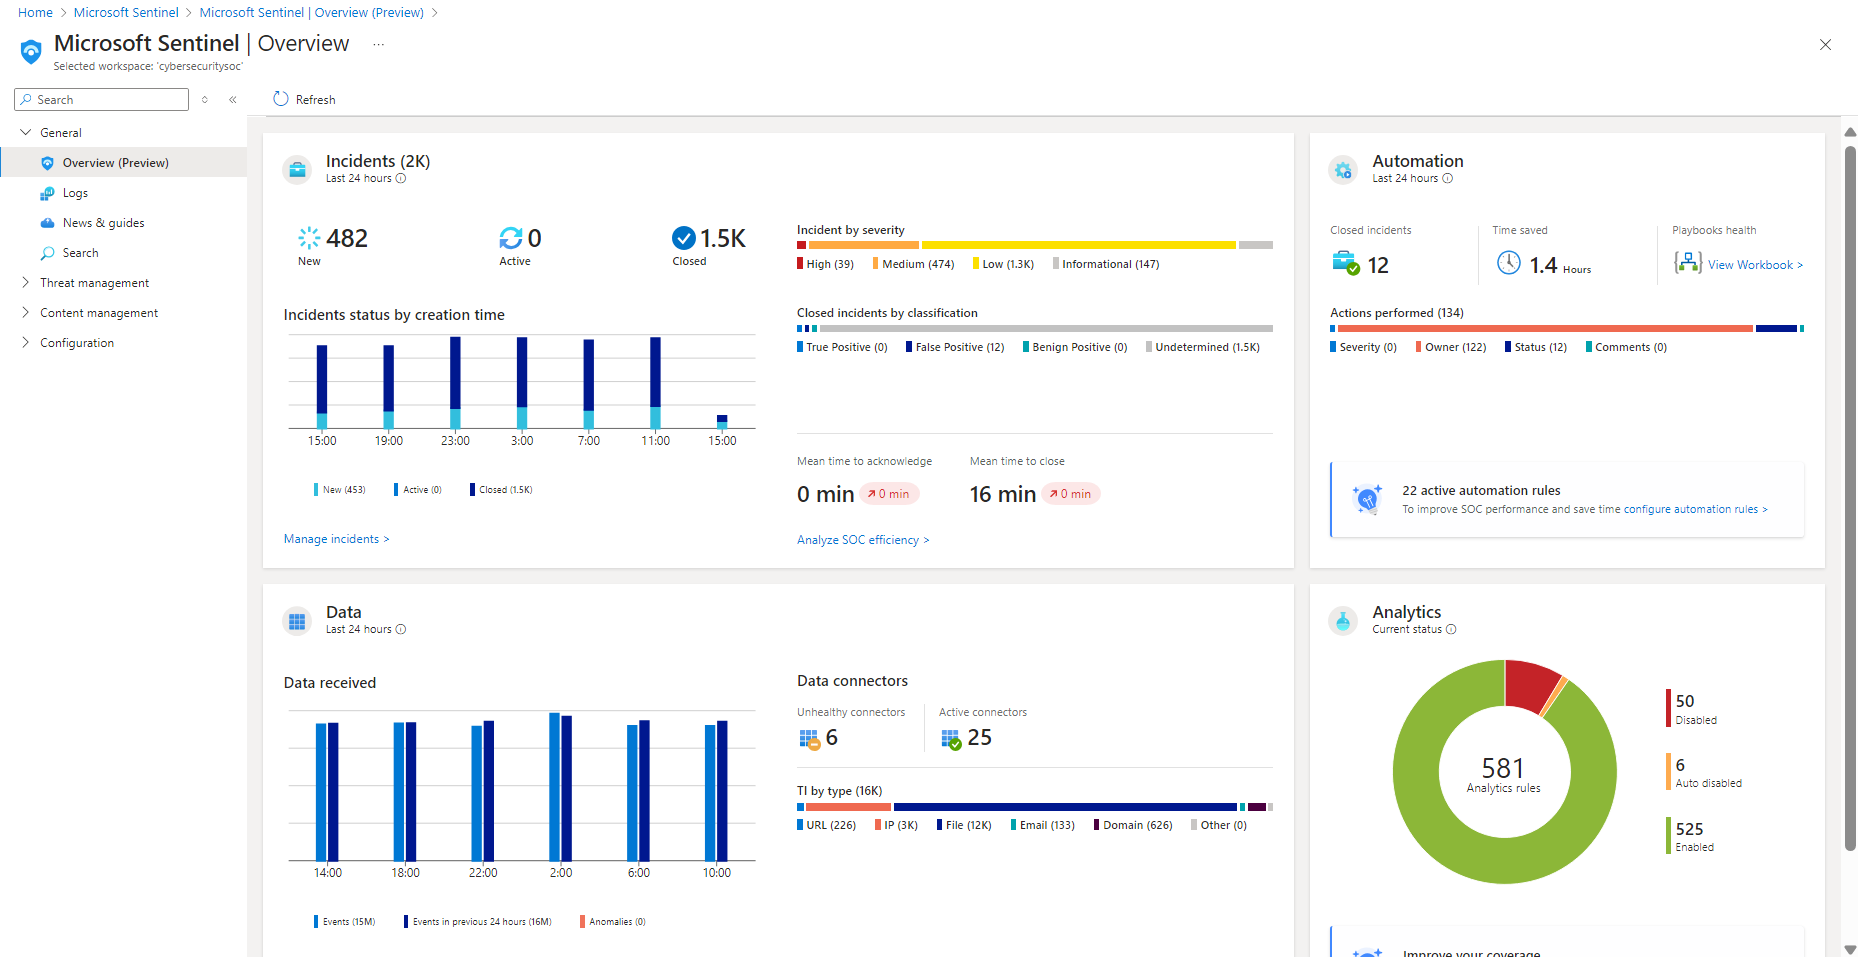
Data for each section of the dashboard is precalculated, and the last refresh time is shown at the top of each section. Select Refresh at the top of the page to refresh the entire page.
View incident data
To help reduce noise and minimize the number of alerts you need to review and investigate, Microsoft Sentinel uses a fusion technique to correlate alerts into incidents. Incidents are actionable groups of related alerts for you to investigate and resolve.
The following image shows an example of the Incidents section on the Overview dashboard:

The Incidents section lists the following data:
- The number of new, active, and closed incidents over the last 24 hours.
- The total number of incidents of each severity.
- The number of closed incidents of each type of closing classification.
- Incident statuses by creation time, in four hour intervals.
- The mean time to acknowledge an incident and the mean time to close an incident, with a link to the SOC efficiency workbook.
Select Manage incidents to jump to the Microsoft Sentinel Incidents page for more details.
View automation data
After deploying automation with Microsoft Sentinel, monitor your workspace's automation in the Automation section of the Overview dashboard.

- Start with a summary of the automation rules activity: Incidents closed by automation, the time the automation saved, and related playbooks health.
Microsoft Sentinel calculates the time saved by automation by finding the average time that a single automation saved, multiplied by the number of incidents resolved by automation. The formula is as follows:(avgWithout - avgWith) * resolvedByAutomation
Where:- avgWithout is the average time it takes for an incident to be resolved without automation.
- avgWith is the average time it takes for an incident to be resolved by automation.
- resolvedByAutomation is the number of incidents that are resolved by automation.
- Below the summary, a graph summarizes the numbers of actions performed by automation, by type of action.
- At the bottom of the section, find a count of the active automation rules with a link to the Automation page.
Select the configure automation rules link to the jump the Automation page, where you can configure more automation.
View status of data records, data collectors, and threat intelligence
In the Data section of the Overview dashboard, track information on data records, data collectors, and threat intelligence.

View the following details:
- The number of records that Microsoft Sentinel collected in the last 24 hours, compared to the previous 24 hours, and anomalies detected in that time period.
- A summary of your data connector status, divided by unhealthy and active connectors. Unhealthy connectors indicate how many connectors have errors. Active connectors are connectors with data streaming into Microsoft Sentinel, as measured by a query included in the connector.
- Threat intelligence records in Microsoft Sentinel, by indicator of compromise.
Select Manage connectors to jump to the Data connectors page, where you can view and manage your data connectors.
View analytics data
Track data for your analytics rules in the Analytics section of the Overview dashboard.
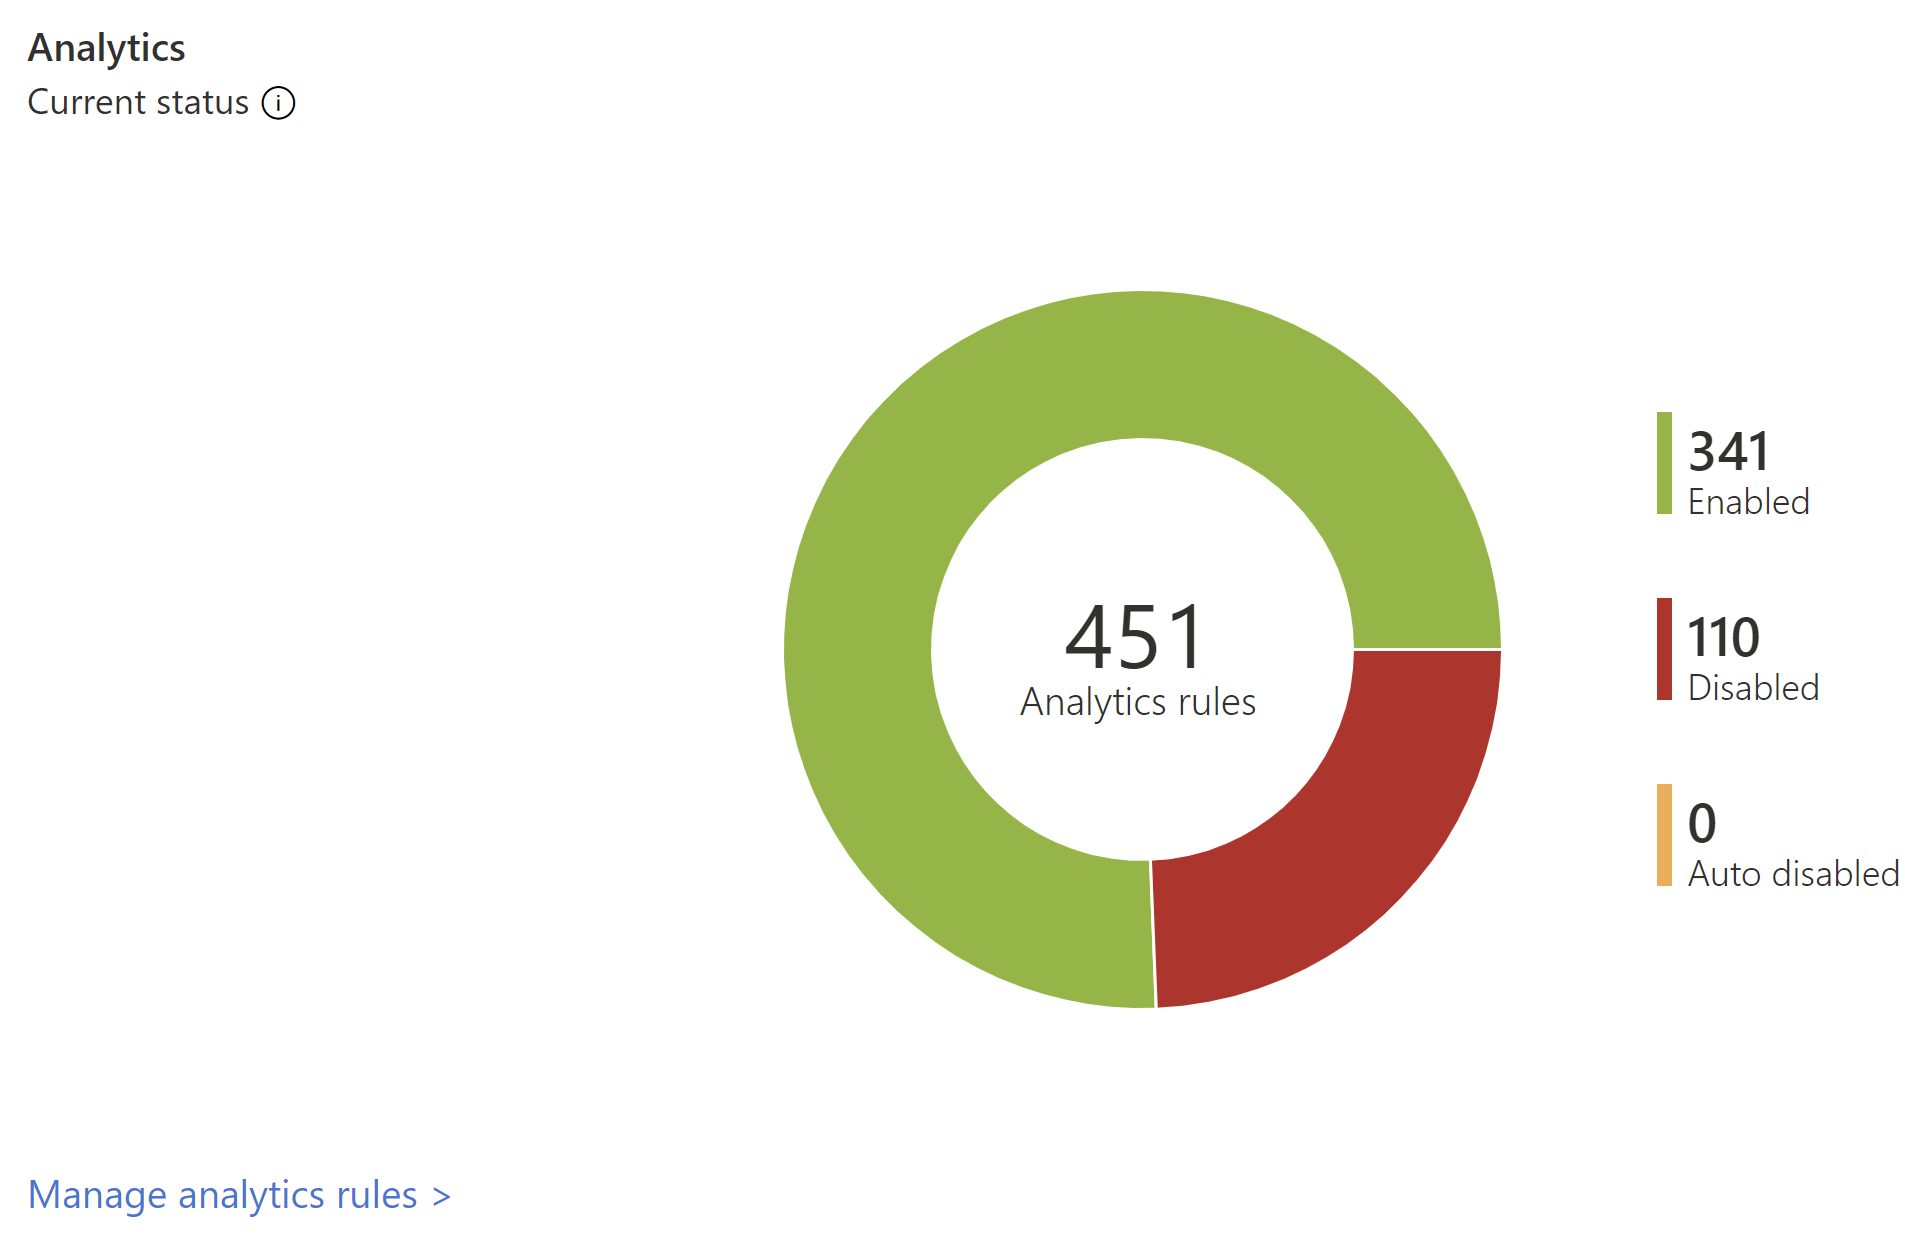
The number of analytics rules in Microsoft Sentinel are shown by status, including enabled, disabled, and autodisabled.
Select the MITRE view link to jump to the MITRE ATT&CK, where you can view how your environment is protected against MITRE ATT&CK tactics and techniques. Select the manage analytics rules link to jump to the Analytics page, where you can view and manage the rules that configure how alerts are triggered.
Next steps
- Use workbook templates to dive deeper into events generated across your environment. For more information, see Visualize and monitor your data by using workbooks in Microsoft Sentinel.
- Turn on Log Analytics query logs to get all queries run from your workspace. For more information, see Audit Microsoft Sentinel queries and activities.
- Learn about the queries used behind the Overview dashboard widgets. For more information, see Deep dive into Microsoft Sentinel’s new Overview dashboard.