Map methods on the call stack while debugging - Visual Studio 2015 (original) (raw)
Share via
Note
This article applies to Visual Studio 2015. If you're looking for the latest Visual Studio documentation, see Visual Studio documentation. We recommend upgrading to the latest version of Visual Studio. Download it here
Create a code map to visually trace the call stack while you’re debugging. You can make notes on the map to track what the code is doing so you can focus on finding bugs.
You’ll need:
- Visual Studio Enterprise
- Code that you can debug, such as Visual C# .NET, Visual Basic .NET, C++, JavaScript, or X++
See: Video: Debug visually with Code Map debugger integration (Channel 9) • Map the call stack • Make notes about the code • Update the map with the next call stack • Add related code to the map • Find bugs using the map • Q & A
For details of the commands and actions you can use when working with code maps, see Browse and rearrange code maps.
Map the call stack
- Start debugging. (Keyboard: F5)
- After your app enters break mode or you step into a function, choose Code Map. (Keyboard: Ctrl + Shift + `)
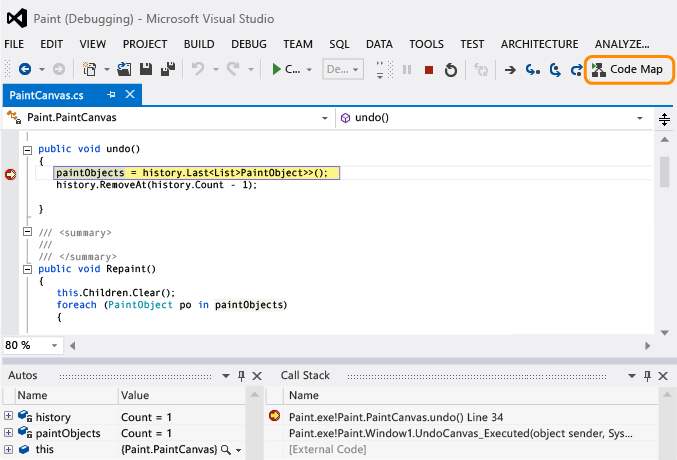
The current call stack appears in orange on a new code map: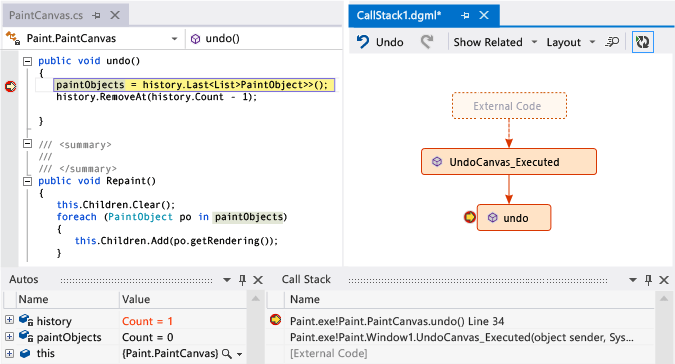
The map will update automatically while you continue debugging. See Update the map with the next call stack.
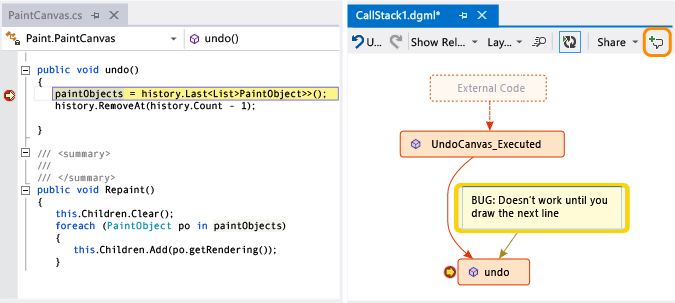
Make notes about the code
Add comments to track what’s happening in the code. To add a new line in a comment, press Shift + Return.
Update the map with the next call stack
Run your app to the next breakpoint or step into a function. The map adds a new call stack.
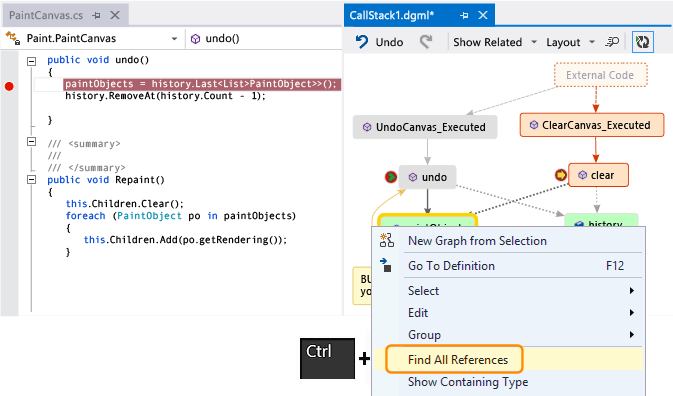
Now you’ve got a map – what next? If you’re working with Visual C# .NET or Visual Basic .NET, add items, such as fields, properties, and other methods, to track what’s happening in the code.
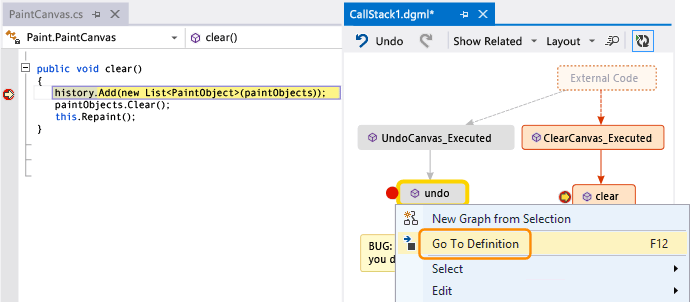
Double-click a method to see its code definition, or use the shortcut menu for the method. (Keyboard: Select the method on the map and press F12)
Add the items that you want to track on the map.
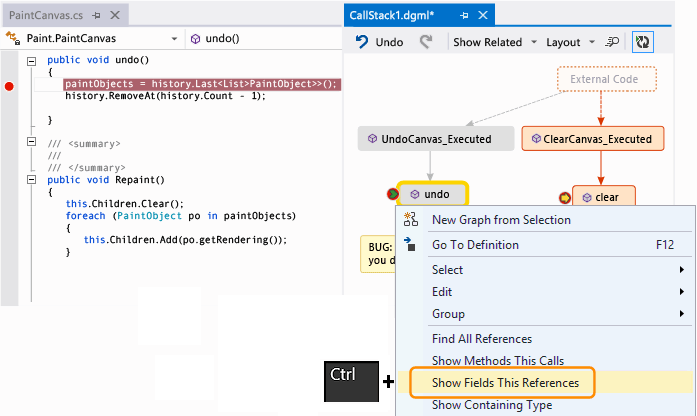
Note
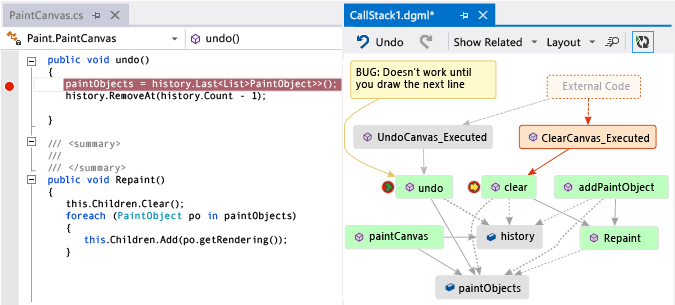
By default, adding items to the map also adds the parent group nodes such as the class, namespace, and assembly. While this is useful, you can keep the map simple by turning off this feature using the Include Parents button on the map toolbar, or by pressing CTRL when you add items.
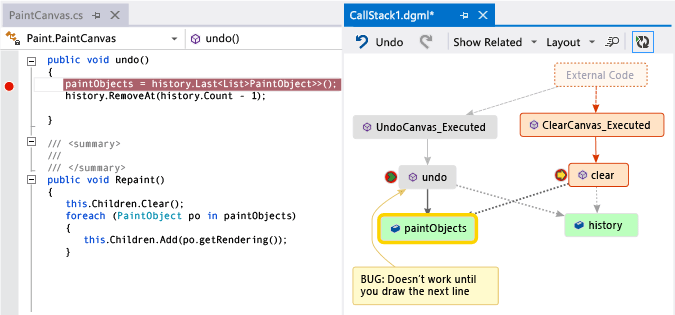
Here you can easily see which methods use the same fields. The most recently added items appear in green.
Continue building the map to see more code.
Find bugs using the map
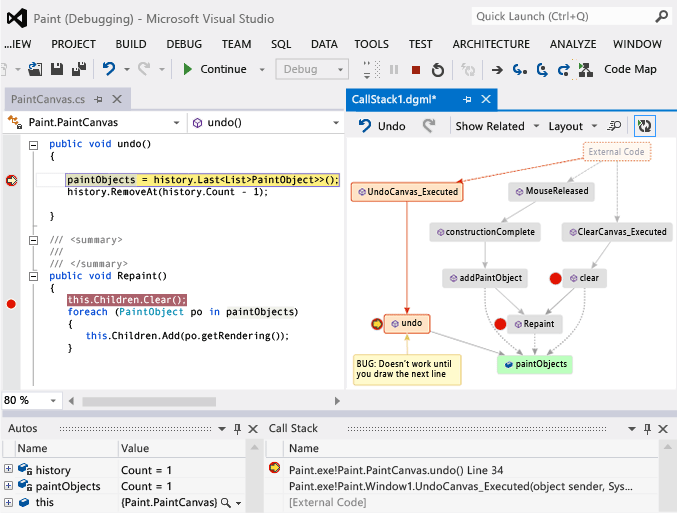
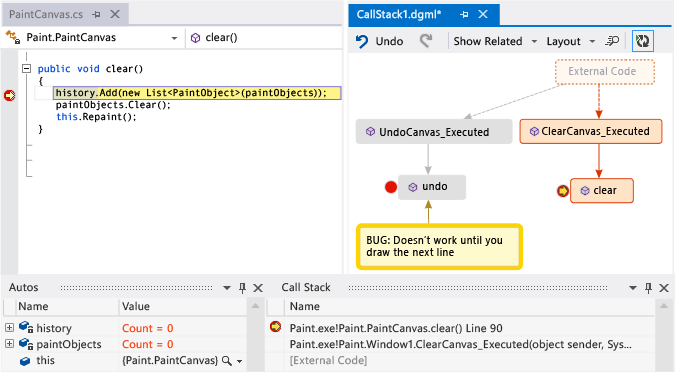
Visualizing your code can help you find bugs faster. For example, suppose you’re investigating a bug in a drawing program. When you draw a line and try to undo it, nothing happens until you draw another line.
So you set breakpoints in the clear, undo, and Repaint methods, start debugging, and build a map like this one:
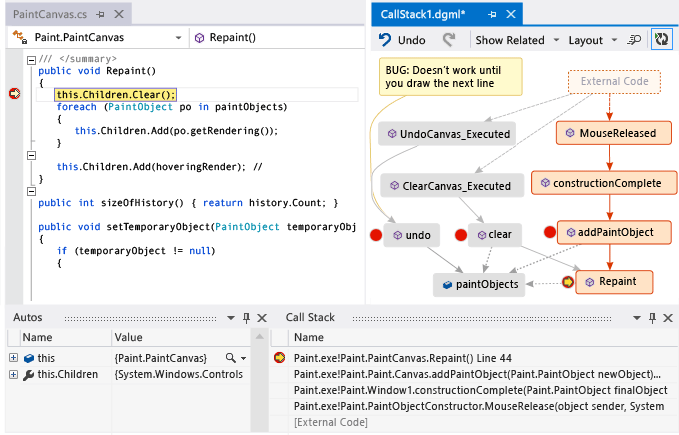
You notice that all the user gestures on the map call Repaint, except for undo. This might explain why undo doesn’t work immediately.
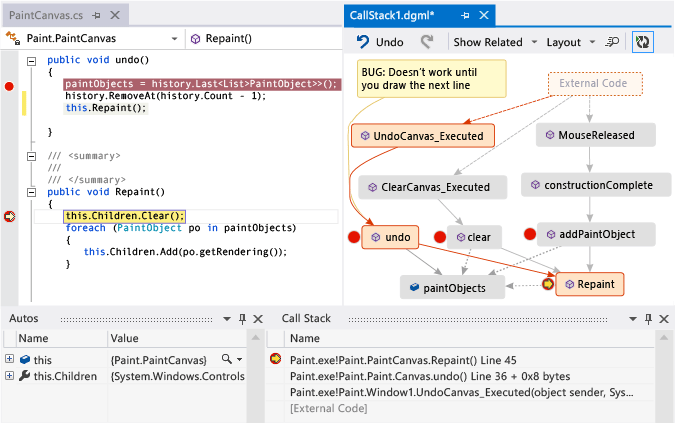
After you fix the bug and continue running the program, the map adds the new call from undo to Repaint:
Q & A
- Not all calls appear on the map. Why?
By default, only your own code appears on the map. To see external code, turn it on in the Call Stack window: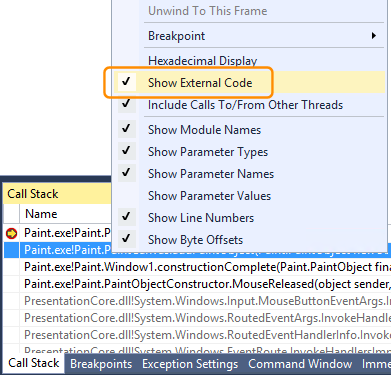
or turn off Enable Just My Code in the Visual Studio debugging options: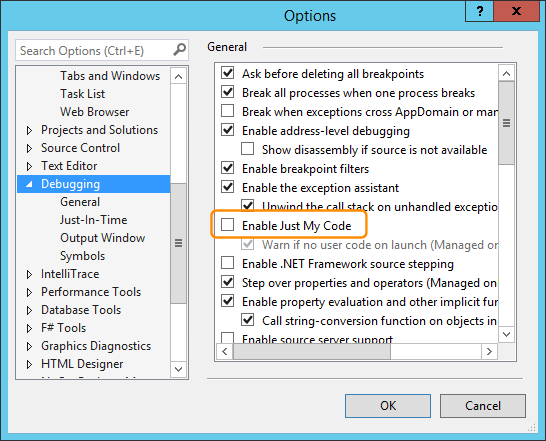
- Does changing the map affect the code?
Changing the map doesn’t affect the code in any way. Feel free to rename, move, or remove anything on the map. - What does this message mean: “The diagram may be based on an older version of the code”?
The code might have changed after you last updated the map. For example, a call on the map might not exist in code anymore. Close the message, then try rebuilding the solution before updating the map again. - How do I control the map’s layout?
Open the Layout menu on the map toolbar:- Change the default layout.
- To stop rearranging the map automatically, turn off Automatically Layout when Debugging.
- To rearrange the map as little as possible when you add items, turn off Incremental Layout.
- Can I share the map with others?
You can export the map, send it to others if you have Microsoft Outlook, or save it to your solution so you can check it into Team Foundation version control.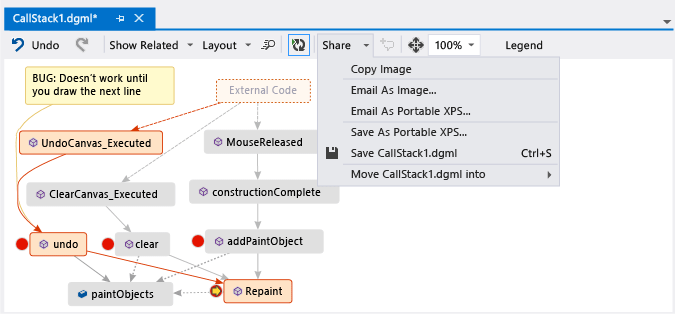
- How do I stop the map from adding new call stacks automatically?
Choose on the map toolbar. To manually add the current call stack to the map, press Ctrl + Shift + `.
The map will continue highlighting existing call stacks on the map while you’re debugging. - What do the item icons and arrows mean?
To get more info about an item, move the mouse pointer over it and look at the item’s tooltip. You can also look at the Legend to learn what each icon means.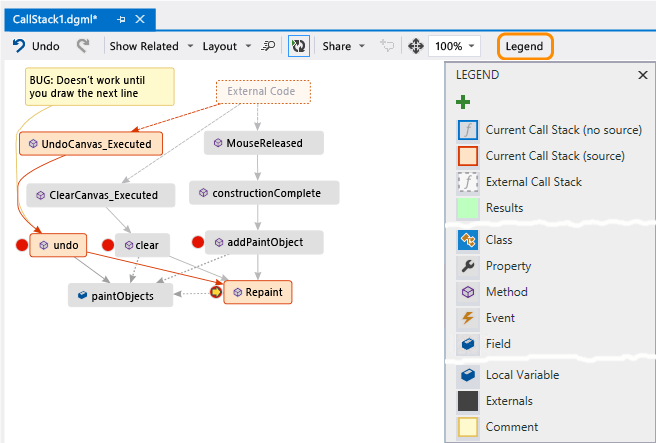
See: Map the call stack • Make notes about the code • Update the map with the next call stack • Add related code to the map • Find bugs using the map
See Also
Map dependencies across your solutions Use code maps to debug your applications Find potential problems using code map analyzers Browse and rearrange code maps