View data with the Tabular visualizer - Visual Studio (Windows) (original) (raw)
While you are debugging in Visual Studio, you can view large collection objects with the built-in tabular visualizers. The visualizer shows data in a tabular view with one row per object and sortable columns for each field and property.
There are two types of tabular visualizers. The DataSet visualizer allows you to view the contents of a DataSet, DataTable, DataView, or DataViewManager. The IEnumerable visualizer allows you to view objects such as Arrays, List, etc.
To open the visualizer, you must be paused during debugging.
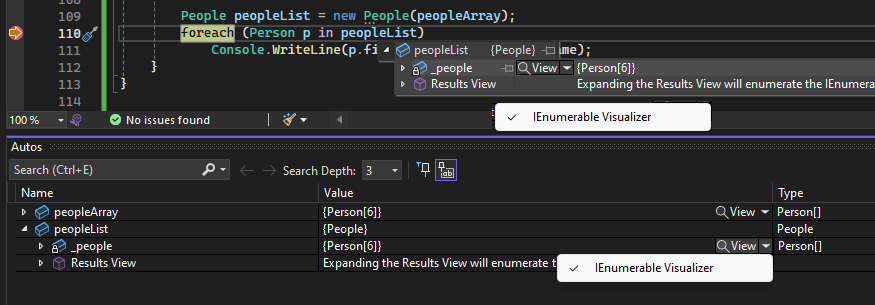
You can access the visualizer by clicking on the magnifying glass icon that appears next to the Value for one of those objects ![]() in a debugger variables window or in a DataTip.
in a debugger variables window or in a DataTip.
DataSet visualizer
The DataSet Visualizer allows you to view the contents of a DataSet, DataTable, DataView, or DataViewManager object.

IEnumerable visualizer
Starting in Visual Studio 2022, you can view IEnumerable collections in a tabular view.
The IEnumerable visualizer helps explore large collection objects in a more streamlined way. The visualizer supports IEnumerable collections where the object type (T) can be simple types or complex types like dictionaries.

You can use the right-click context menu to customize the view:
- Select Hide Column to hide duplicate data.
- Select Expand Column to see more details items in the complex data.
- Select Hide Children to get a more concise view of your data.
Modify the expression in the IEnumerable visualizer
Starting in Visual Studio 2022 version 17.11, you can directly change the Expression textbox for the IEnumerable visualizer with a modified LINQ expression. The visualizer data gets updated, reflecting the data change resulting from your new query.
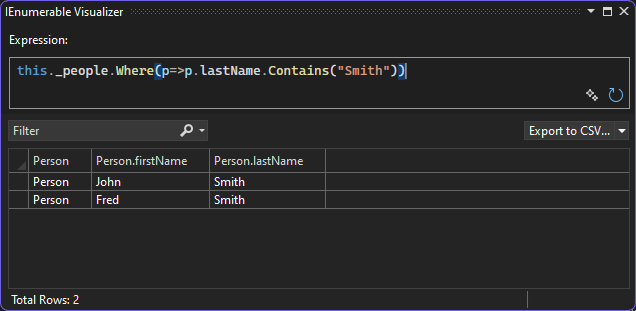
Starting in Visual Studio 2022 version 17.12 Preview 3, you get IntelliSense support to help you edit the expression.
Starting in Visual Studio 2022 version 17.13 Preview 2, you can get inline AI assistance to edit the LINQ expression. If you have Copilot activated, click the GitHub Copilot sparkle icon ![]() to open the inline Copilot Chat.
to open the inline Copilot Chat.

You can describe your query in natural language, and GitHub Copilot will generate the corresponding LINQ query. To apply LINQ query filtering to the visualizer, press Enter.
After at least one LINQ query has been generated by GitHub Copilot, you can choose to select the Continue in Chat button. This action opens a dedicated GitHub Copilot Chat window where you can refine your query, ask follow-up questions, view LINQ syntax examples, or explore alternative approaches in more detail. To apply a suggested LINQ query to the visualizer, use the Show in Visualizer button in the chat.
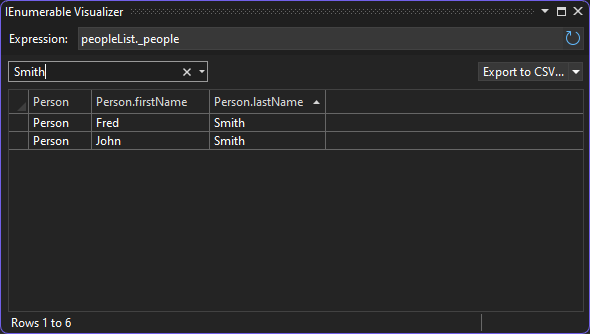
Filter, sort, and export visualizer data
- Both DataSet and IEnumerable support filtering, sorting, and exporting of visualizer data.
- You can sort the visualizer columns in ascending/descending order by clicking on the column name.
- You also can filter visualizer data based on a filter string. Enter the string in the filter box in the upper right corner and press Enter. The Visualizer returns all the rows that contain a value that matches the filter string.
- You can export the data from IEnumerable visualizers in CSV/Excel format using the dropdown on the top right corner.
- You can also export the filtered and sorted results in CSV/Excel format.