pandas.DataFrame.plot — pandas 3.0.0.dev0+2097.gcdc5b7418e documentation (original) (raw)
DataFrame.plot(*args, **kwargs)[source]#
Make plots of Series or DataFrame.
Uses the backend specified by the option plotting.backend. By default, matplotlib is used.
Parameters:
dataSeries or DataFrame
The object for which the method is called.
Attributes
Returns:
matplotlib.axes.Axes or numpy.ndarray of them
If the backend is not the default matplotlib one, the return value will be the object returned by the backend.
Notes
- See matplotlib documentation online for more on this subject
- If kind = ‘bar’ or ‘barh’, you can specify relative alignments for bar plot layout by position keyword. From 0 (left/bottom-end) to 1 (right/top-end). Default is 0.5 (center)
Examples
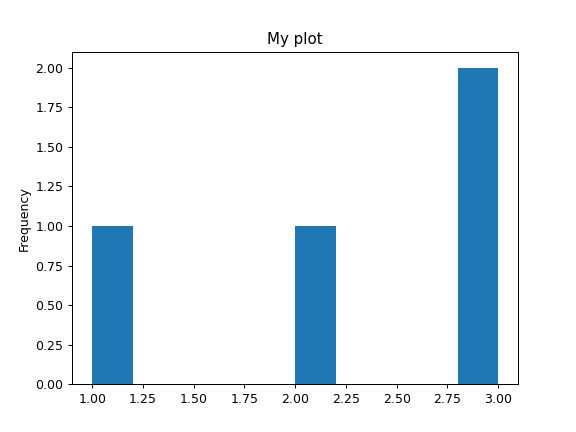
For Series:
ser = pd.Series([1, 2, 3, 3]) plot = ser.plot(kind="hist", title="My plot")
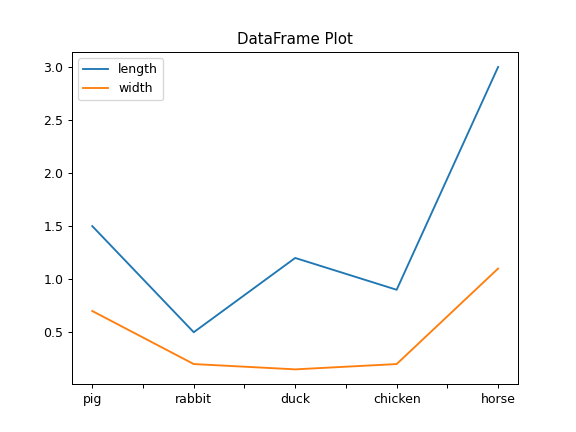
For DataFrame:
df = pd.DataFrame( ... { ... "length": [1.5, 0.5, 1.2, 0.9, 3], ... "width": [0.7, 0.2, 0.15, 0.2, 1.1], ... }, ... index=["pig", "rabbit", "duck", "chicken", "horse"], ... ) plot = df.plot(title="DataFrame Plot")
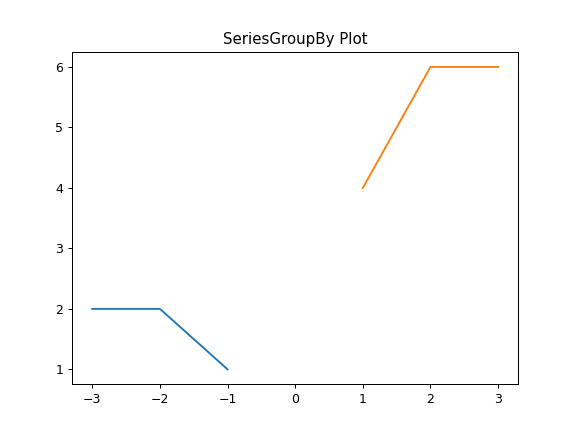
For SeriesGroupBy:
lst = [-1, -2, -3, 1, 2, 3] ser = pd.Series([1, 2, 2, 4, 6, 6], index=lst) plot = ser.groupby(lambda x: x > 0).plot(title="SeriesGroupBy Plot")
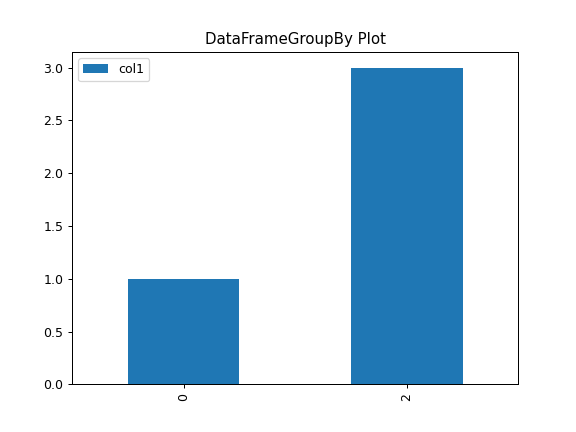
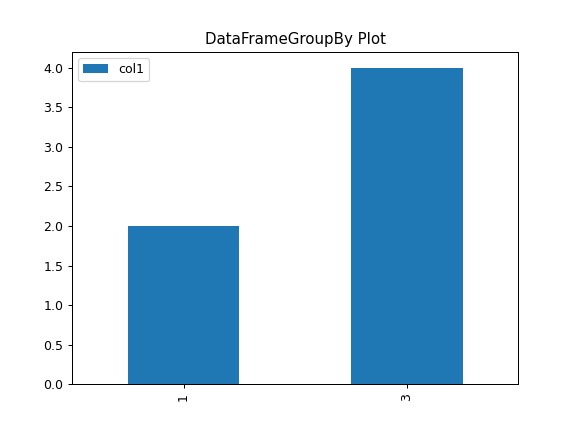
For DataFrameGroupBy:
df = pd.DataFrame({"col1": [1, 2, 3, 4], "col2": ["A", "B", "A", "B"]}) plot = df.groupby("col2").plot(kind="bar", title="DataFrameGroupBy Plot")