pandas.core.groupby.DataFrameGroupBy.boxplot — pandas 3.0.0.dev0+2104.ge637b4290d documentation (original) (raw)
DataFrameGroupBy.boxplot(subplots=True, column=None, fontsize=None, rot=0, grid=True, ax=None, figsize=None, layout=None, sharex=False, sharey=True, backend=None, **kwargs)[source]#
Make box plots from DataFrameGroupBy data.
Parameters:
groupedDataFrameGroupBy
The grouped DataFrame object over which to create the box plots.
subplotsbool
False- no subplots will be usedTrue- create a subplot for each group.
columncolumn name or list of names, or vector
Can be any valid input to groupby.
fontsizefloat or str
Font size for the labels.
rotfloat
Rotation angle of labels (in degrees) on the x-axis.
gridbool
Whether to show grid lines on the plot.
axMatplotlib axis object, default None
The axes on which to draw the plots. If None, uses the current axes.
figsizetuple of (float, float)
The figure size in inches (width, height).
layouttuple (optional)
The layout of the plot: (rows, columns).
sharexbool, default False
Whether x-axes will be shared among subplots.
shareybool, default True
Whether y-axes will be shared among subplots.
backendstr, default None
Backend to use instead of the backend specified in the optionplotting.backend. For instance, ‘matplotlib’. Alternatively, to specify the plotting.backend for the whole session, setpd.options.plotting.backend.
**kwargs
All other plotting keyword arguments to be passed to matplotlib’s boxplot function.
Returns:
dict or DataFrame.boxplot return value
If subplots=True, returns a dictionary of group keys to the boxplot return values. If subplots=False, returns the boxplot return value of a single DataFrame.
See also
DataFrame.boxplot
Create a box plot from a DataFrame.
Series.plot
Plot a Series.
Examples
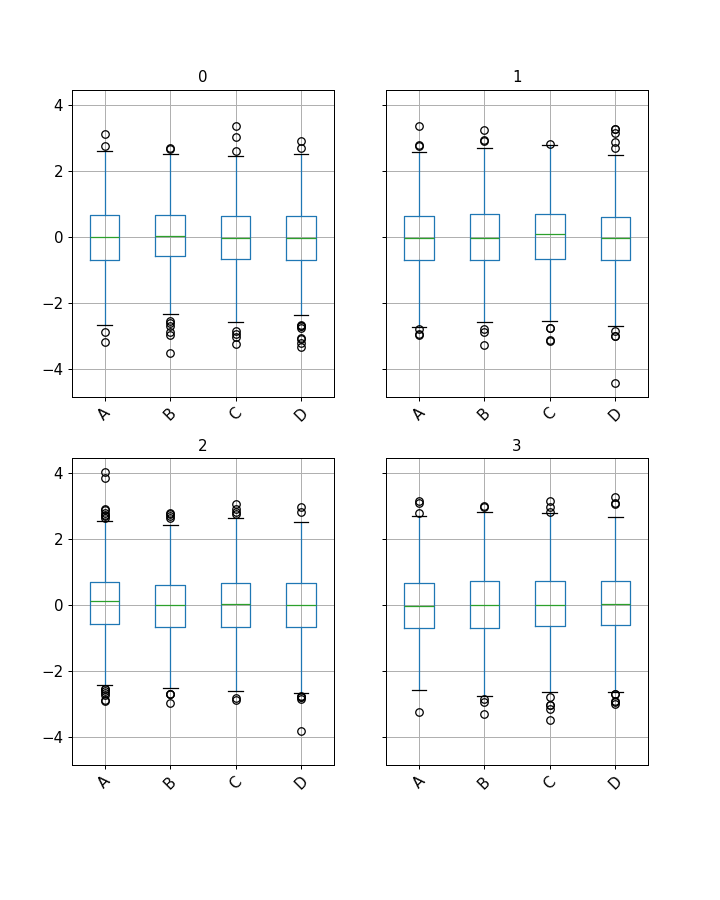
You can create boxplots for grouped data and show them as separate subplots:
import itertools tuples = [t for t in itertools.product(range(1000), range(4))] index = pd.MultiIndex.from_tuples(tuples, names=["lvl0", "lvl1"]) data = np.random.randn(len(index), 4) df = pd.DataFrame(data, columns=list("ABCD"), index=index) grouped = df.groupby(level="lvl1") grouped.boxplot(rot=45, fontsize=12, figsize=(8, 10))
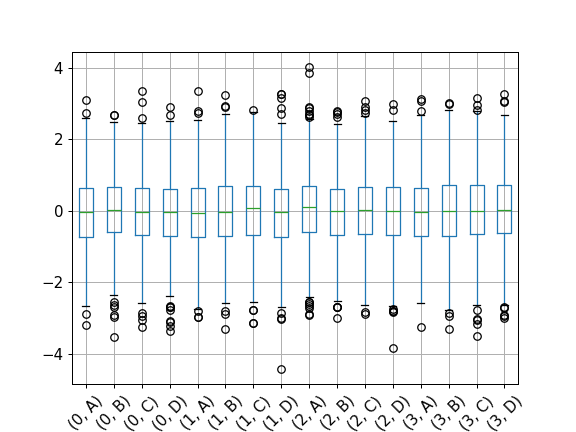
The subplots=False option shows the boxplots in a single figure.
grouped.boxplot(subplots=False, rot=45, fontsize=12)