pandas.plotting.register_matplotlib_converters — pandas 3.0.0rc0+48.gc16f4591ee documentation (original) (raw)
pandas.plotting.register_matplotlib_converters()[source]#
Register pandas formatters and converters with matplotlib.
This function modifies the global matplotlib.units.registrydictionary. pandas adds custom converters for
- pd.Timestamp
- pd.Period
- np.datetime64
- datetime.datetime
- datetime.date
- datetime.time
Examples
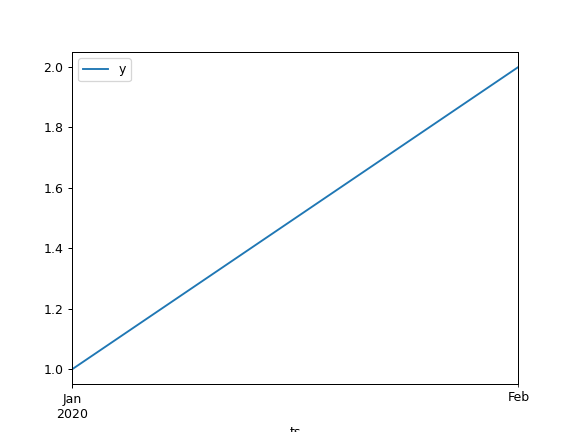
The following line is done automatically by pandas so the plot can be rendered:
pd.plotting.register_matplotlib_converters()
df = pd.DataFrame( ... {"ts": pd.period_range("2020", periods=2, freq="M"), "y": [1, 2]} ... ) plot = df.plot.line(x="ts", y="y")
Unsetting the register manually an error will be raised:
pd.set_option( ... "plotting.matplotlib.register_converters", False ... ) df.plot.line(x="ts", y="y") Traceback (most recent call last): TypeError: float() argument must be a string or a real number, not 'Period'