pandas.Series.hist — pandas 2.3.3 documentation (original) (raw)
Series.hist(by=None, ax=None, grid=True, xlabelsize=None, xrot=None, ylabelsize=None, yrot=None, figsize=None, bins=10, backend=None, legend=False, **kwargs)[source]#
Draw histogram of the input series using matplotlib.
Parameters:
byobject, optional
If passed, then used to form histograms for separate groups.
axmatplotlib axis object
If not passed, uses gca().
gridbool, default True
Whether to show axis grid lines.
xlabelsizeint, default None
If specified changes the x-axis label size.
xrotfloat, default None
Rotation of x axis labels.
ylabelsizeint, default None
If specified changes the y-axis label size.
yrotfloat, default None
Rotation of y axis labels.
figsizetuple, default None
Figure size in inches by default.
binsint or sequence, default 10
Number of histogram bins to be used. If an integer is given, bins + 1 bin edges are calculated and returned. If bins is a sequence, gives bin edges, including left edge of first bin and right edge of last bin. In this case, bins is returned unmodified.
backendstr, default None
Backend to use instead of the backend specified in the optionplotting.backend. For instance, ‘matplotlib’. Alternatively, to specify the plotting.backend for the whole session, setpd.options.plotting.backend.
legendbool, default False
Whether to show the legend.
**kwargs
To be passed to the actual plotting function.
Returns:
matplotlib.AxesSubplot
A histogram plot.
Examples
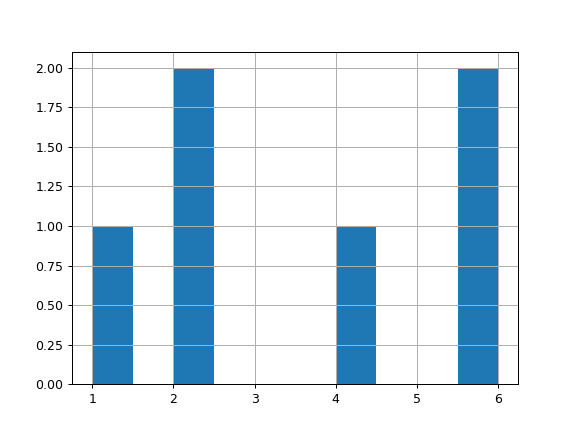
For Series:
lst = ['a', 'a', 'a', 'b', 'b', 'b'] ser = pd.Series([1, 2, 2, 4, 6, 6], index=lst) hist = ser.hist()
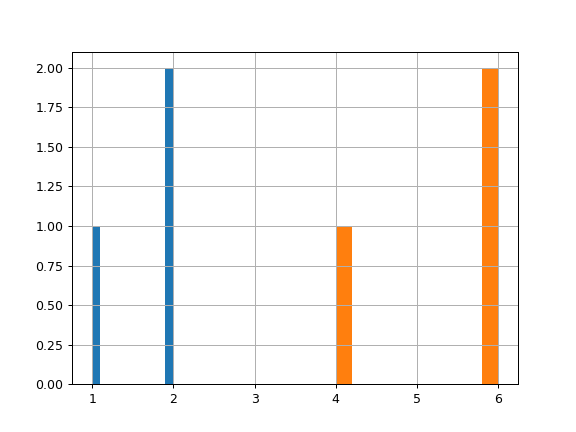
For Groupby:
lst = ['a', 'a', 'a', 'b', 'b', 'b'] ser = pd.Series([1, 2, 2, 4, 6, 6], index=lst) hist = ser.groupby(level=0).hist()