pandas.plotting.bootstrap_plot — pandas 2.3.3 documentation (original) (raw)
pandas.plotting.bootstrap_plot(series, fig=None, size=50, samples=500, **kwds)[source]#
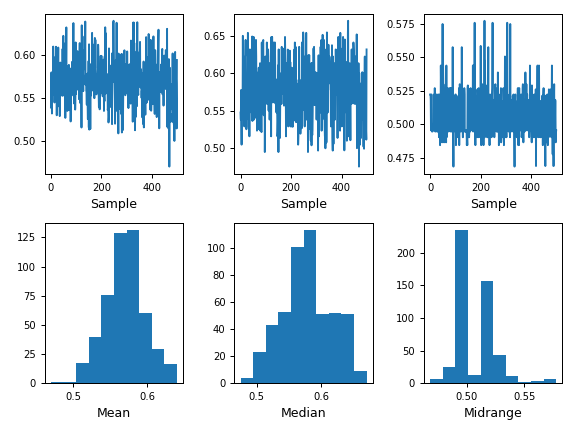
Bootstrap plot on mean, median and mid-range statistics.
The bootstrap plot is used to estimate the uncertainty of a statistic by relying on random sampling with replacement [1]. This function will generate bootstrapping plots for mean, median and mid-range statistics for the given number of samples of the given size.
Parameters:
seriespandas.Series
Series from where to get the samplings for the bootstrapping.
figmatplotlib.figure.Figure, default None
If given, it will use the fig reference for plotting instead of creating a new one with default parameters.
sizeint, default 50
Number of data points to consider during each sampling. It must be less than or equal to the length of the series.
samplesint, default 500
Number of times the bootstrap procedure is performed.
**kwds
Options to pass to matplotlib plotting method.
Returns:
matplotlib.figure.Figure
Matplotlib figure.
Examples
This example draws a basic bootstrap plot for a Series.
s = pd.Series(np.random.uniform(size=100)) pd.plotting.bootstrap_plot(s)
<Figure size 640x480 with 6 Axes>