pandas.plotting.plot_params — pandas 2.3.1 documentation (original) (raw)
pandas.plotting.plot_params = {'xaxis.compat': False}#
Stores pandas plotting options.
Allows for parameter aliasing so you can just use parameter names that are the same as the plot function parameters, but is stored in a canonical format that makes it easy to breakdown into groups later.
Examples
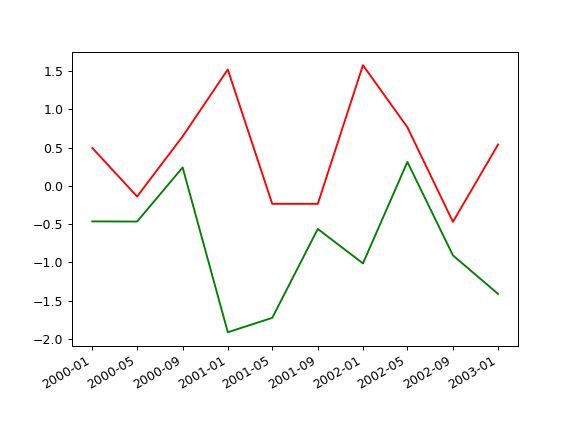
np.random.seed(42) df = pd.DataFrame({'A': np.random.randn(10), ... 'B': np.random.randn(10)}, ... index=pd.date_range("1/1/2000", ... freq='4MS', periods=10)) with pd.plotting.plot_params.use("x_compat", True): ... _ = df["A"].plot(color="r") ... _ = df["B"].plot(color="g")