arviz.plot_elpd — ArviZ dev documentation (original) (raw)
arviz.plot_elpd(compare_dict, color='C0', xlabels=False, figsize=None, textsize=None, coords=None, legend=False, threshold=None, ax=None, ic=None, scale=None, var_name=None, plot_kwargs=None, backend=None, backend_kwargs=None, show=None)[source]#
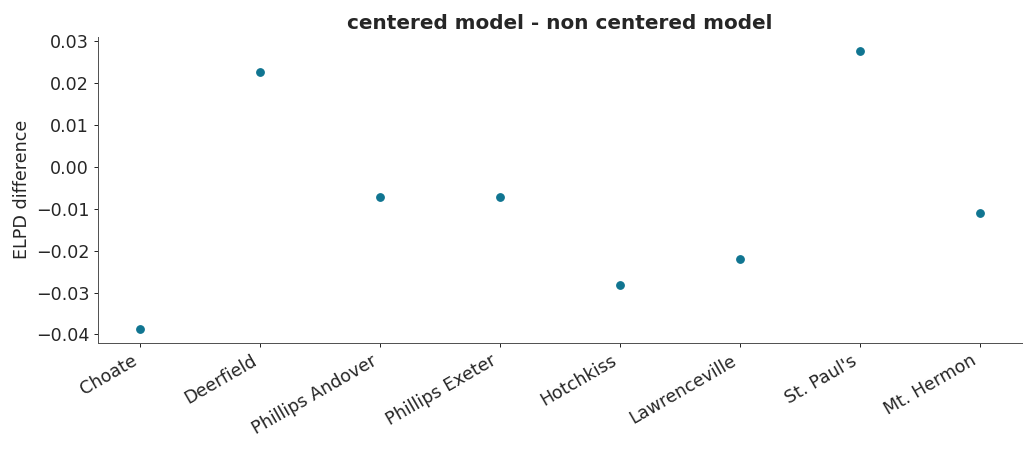
Plot pointwise elpd differences between two or more models.
Pointwise model comparison based on their expected log pointwise predictive density (ELPD).
Parameters:
compare_dictmapping of {strELPDData or InferenceData}
A dictionary mapping the model name to the object containing inference data or the result of arviz.loo() or arviz.waic() functions. Refer to arviz.convert_to_inference_data() for details on possible dict items.
colorstr or array_like, default “C0”
Colors of the scatter plot. If color is a str all dots will have the same color. If it is the size of the observations, each dot will have the specified color. Otherwise, it will be interpreted as a list of the dims to be used for the color code.
Use coords as xticklabels.
figsize(float, float), optional
If None, size is (8 + numvars, 8 + numvars).
textsizefloat, optional
Text size for labels. If None it will be autoscaled based on figsize.
coordsmapping, optional
Coordinates of points to plot. All values are used for computation, but only a subset can be plotted for convenience. See this sectionfor usage examples.
Include a legend to the plot. Only taken into account when color argument is a dim name.
thresholdfloat, optional
If some elpd difference is larger than threshold * elpd.std(), show its label. IfNone, no observations will be highlighted.
icstr, optional
Information Criterion (“loo” for PSIS-LOO, “waic” for WAIC) used to compare models. Defaults to rcParams["stats.information_criterion"]. Only taken into account when input is arviz.InferenceData.
scalestr, optional
Scale argument passed to arviz.loo() or arviz.waic(), see their docs for details. Only taken into account when values in compare_dict arearviz.InferenceData.
var_namestr, optional
Argument passed to to arviz.loo() or arviz.waic(), see their docs for details. Only taken into account when values in compare_dict arearviz.InferenceData.
plot_kwargsdicts, optional
Additional keywords passed to matplotlib.axes.Axes.scatter().
axaxes, optional
matplotlib.axes.Axes or bokeh.plotting.Figure.
backend{“matplotlib”, “bokeh”}, default “matplotlib”
Select plotting backend.
backend_kwargsdict, optional
These are kwargs specific to the backend being used, passed tomatplotlib.pyplot.subplots() or bokeh.plotting.figure. For additional documentation check the plotting method of the backend.
showbool, optional
Call backend show function.
Returns:
axesmatplotlib Axes or Bokeh Figure
See also
Summary plot for model comparison.
Compute Pareto-smoothed importance sampling leave-one-out cross-validation (PSIS-LOO-CV).
Compute the widely applicable information criterion.
Notes
The ELPD is estimated either by Pareto smoothed importance sampling leave-one-out cross-validation (LOO) or using the widely applicable information criterion (WAIC). We recommend LOO in line with the work presented by [1].
References
Examples
Compare pointwise PSIS-LOO for centered and non centered models of the 8-schools problem using matplotlib.
import arviz as az idata1 = az.load_arviz_data("centered_eight") idata2 = az.load_arviz_data("non_centered_eight") az.plot_elpd( {"centered model": idata1, "non centered model": idata2}, xlabels=True )
import arviz as az idata1 = az.load_arviz_data("centered_eight") idata2 = az.load_arviz_data("non_centered_eight") az.plot_elpd( {"centered model": idata1, "non centered model": idata2}, backend="bokeh" )