arviz.plot_parallel — ArviZ dev documentation (original) (raw)
arviz.plot_parallel(data, var_names=None, filter_vars=None, coords=None, figsize=None, textsize=None, legend=True, colornd='k', colord='C1', shadend=0.025, labeller=None, ax=None, norm_method=None, backend=None, backend_config=None, backend_kwargs=None, show=None)[source]#
Plot parallel coordinates plot showing posterior points with and without divergences.
Described by https://arxiv.org/abs/1709.01449
Parameters:
data: obj
Any object that can be converted to an arviz.InferenceData object refer to documentation of arviz.convert_to_dataset() for details
var_names: list of variable names
Variables to be plotted, if None all variables are plotted. Can be used to change the order of the plotted variables. Prefix the variables by ~ when you want to exclude them from the plot.
filter_vars: {None, “like”, “regex”}, optional, default=None
If None (default), interpret var_names as the real variables names. If “like”, interpret var_names as substrings of the real variables names. If “regex”, interpret var_names as regular expressions on the real variables names. A lapandas.filter.
coords: mapping, optional
Coordinates of var_names to be plotted. Passed to xarray.Dataset.sel().
figsize: tuple
Figure size. If None it will be defined automatically.
textsize: float
Text size scaling factor for labels, titles and lines. If None it will be autoscaled based on figsize.
legend: bool
Flag for plotting legend (defaults to True)
colornd: valid matplotlib color
color for non-divergent points. Defaults to ‘k’
colord: valid matplotlib color
color for divergent points. Defaults to ‘C1’
shadend: float
Alpha blending value for non-divergent points, between 0 (invisible) and 1 (opaque). Defaults to .025
labellerlabeller instance, optional
Class providing the method make_label_vert to generate the labels in the plot. Read the Label guide for more details and usage examples.
ax: axes, optional
Matplotlib axes or bokeh figures.
norm_method: str
Method for normalizing the data. Methods include normal, minmax and rank. Defaults to none.
backend: str, optional
Select plotting backend {“matplotlib”,”bokeh”}. Default “matplotlib”.
backend_config: dict, optional
Currently specifies the bounds to use for bokeh axes. Defaults to value set in rcParams.
backend_kwargs: bool, optional
These are kwargs specific to the backend being used, passed tomatplotlib.pyplot.subplots() orbokeh.plotting.figure().
show: bool, optional
Call backend show function.
Returns:
axes: matplotlib axes or bokeh figures
See also
Plot a scatter, kde and/or hexbin matrix with (optional) marginals on the diagonal.
Plot distribution (histogram or kernel density estimates) and sampled values or rank plot
Examples
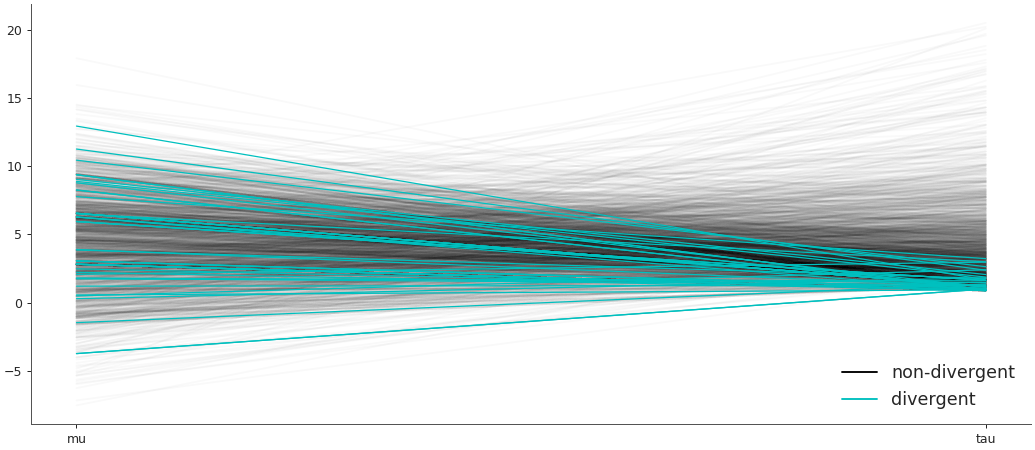
Plot default parallel plot
import arviz as az data = az.load_arviz_data('centered_eight') az.plot_parallel(data, var_names=["mu", "tau"])
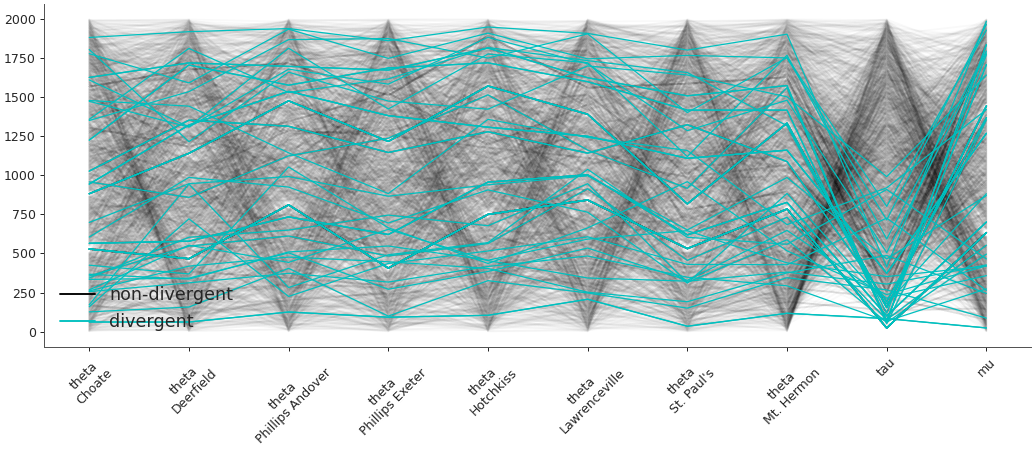
Plot parallel plot with normalization
az.plot_parallel(data, var_names=["theta", "tau", "mu"], norm_method="normal")
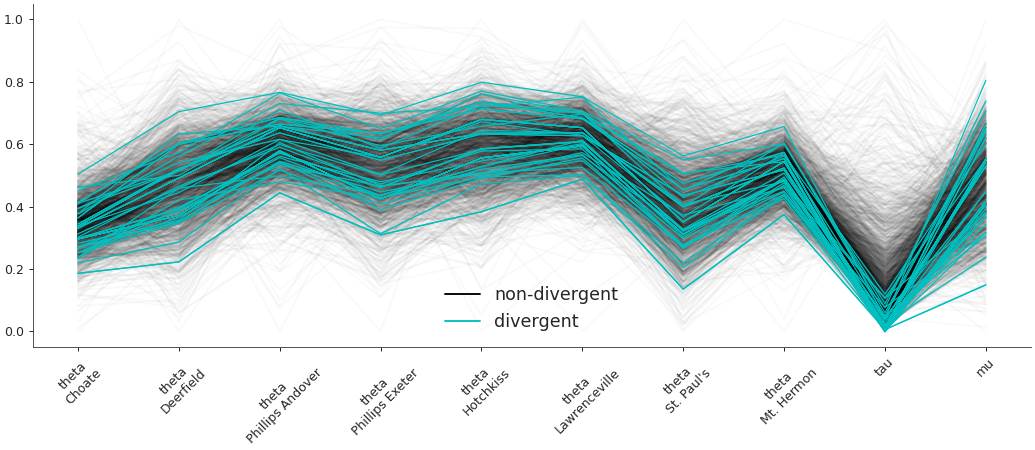
Plot parallel plot with minmax
ax = az.plot_parallel(data, var_names=["theta", "tau", "mu"], norm_method="minmax") ax.set_xticklabels(ax.get_xticklabels(), rotation=45)
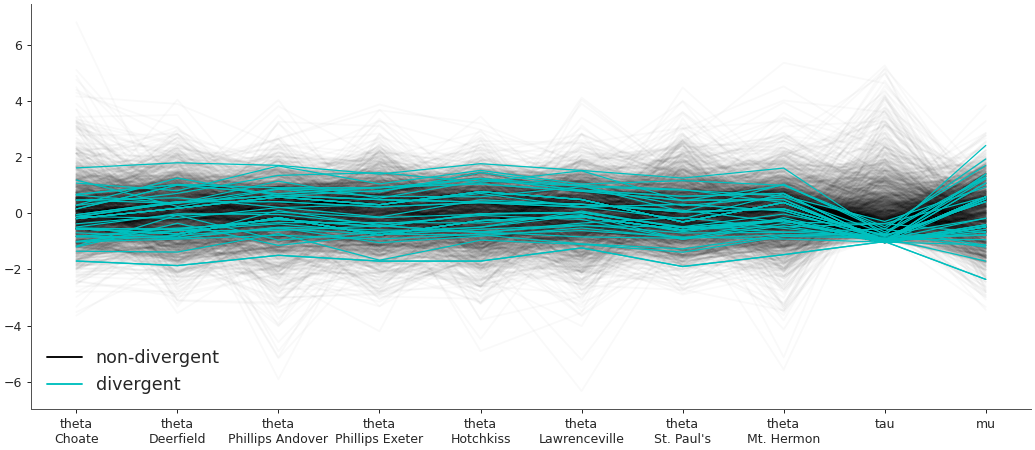
Plot parallel plot with rank
ax = az.plot_parallel(data, var_names=["theta", "tau", "mu"], norm_method="rank") ax.set_xticklabels(ax.get_xticklabels(), rotation=45)