Bode demo — PythonQwt 0.14 Manual (original) (raw)
import os
import numpy as np from qtpy.QtCore import Qt from qtpy.QtGui import QFont, QIcon, QPageLayout, QPen, QPixmap from qtpy.QtPrintSupport import QPrintDialog, QPrinter from qtpy.QtWidgets import ( QFrame, QHBoxLayout, QLabel, QMainWindow, QToolBar, QToolButton, QWidget, )
from qwt import ( QwtLegend, QwtLogScaleEngine, QwtPlot, QwtPlotCurve, QwtPlotGrid, QwtPlotMarker, QwtPlotRenderer, QwtSymbol, QwtText, ) from qwt.tests import utils
print_xpm = [ "32 32 12 1", "a c #ffffff", "h c #ffff00", "c c #ffffff", "f c #dcdcdc", "b c #c0c0c0", "j c #a0a0a4", "e c #808080", "g c #808000", "d c #585858", "i c #00ff00", "# c #000000", ". c None", "................................", "................................", "...........###..................", "..........#abb###...............", ".........#aabbbbb###............", ".........#ddaaabbbbb###.........", "........#ddddddaaabbbbb###......", ".......#deffddddddaaabbbbb###...", "......#deaaabbbddddddaaabbbbb###", ".....#deaaaaaaabbbddddddaaabbbb#", "....#deaaabbbaaaa#ddedddfggaaad#", "...#deaaaaaaaaaa#ddeeeeafgggfdd#", "..#deaaabbbaaaa#ddeeeeabbbbgfdd#", ".#deeefaaaaaaa#ddeeeeabbhhbbadd#", "#aabbbeeefaaa#ddeeeeabbbbbbaddd#", "#bbaaabbbeee#ddeeeeabbiibbadddd#", "#bbbbbaaabbbeeeeeeabbbbbbaddddd#", "#bjbbbbbbaaabbbbeabbbbbbadddddd#", "#bjjjjbbbbbbaaaeabbbbbbaddddddd#", "#bjaaajjjbbbbbbaaabbbbadddddddd#", "#bbbbbaaajjjbbbbbbaaaaddddddddd#", "#bjbbbbbbaaajjjbbbbbbddddddddd#.", "#bjjjjbbbbbbaaajjjbbbdddddddd#..", "#bjaaajjjbbbbbbjaajjbddddddd#...", "#bbbbbaaajjjbbbjbbaabdddddd#....", "###bbbbbbaaajjjjbbbbbddddd#.....", "...###bbbbbbaaajbbbbbdddd#......", "......###bbbbbbjbbbbbddd#.......", ".........###bbbbbbbbbdd#........", "............###bbbbbbd#.........", "...............###bbb#..........", "..................###...........", ]
class BodePlot(QwtPlot): def init(self, *args): QwtPlot.init(self, *args)
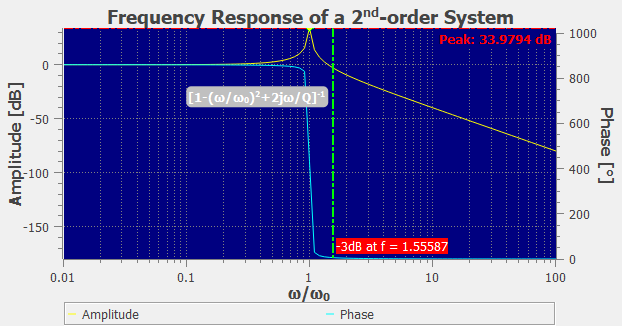
    self.setTitle("Frequency Response of a 2<sup>nd</sup>-order System")
    self.setCanvasBackground(Qt.darkBlue)

    # legend
    legend = QwtLegend()
    legend.setFrameStyle(QFrame.Box | QFrame.Sunken)
    self.insertLegend(legend, QwtPlot.BottomLegend)

    # grid
    QwtPlotGrid.make(plot=self, enableminor=(True, False), color=Qt.darkGray)

    # axes
    self.enableAxis(QwtPlot.yRight)
    self.setAxisTitle(QwtPlot.xBottom, "\u03c9/\u03c9<sub>0</sub>")
    self.setAxisTitle(QwtPlot.yLeft, "Amplitude [dB]")
    self.setAxisTitle(QwtPlot.yRight, "Phase [\u00b0]")

    self.setAxisMaxMajor(QwtPlot.xBottom, 6)
    self.setAxisMaxMinor(QwtPlot.xBottom, 10)
    self.setAxisScaleEngine(QwtPlot.xBottom, QwtLogScaleEngine())

    # curves
    self.curve1 = QwtPlotCurve.make(
        title="Amplitude", linecolor=Qt.yellow, plot=self, antialiased=True
    )
    self.curve2 = QwtPlotCurve.make(
        title="Phase", linecolor=Qt.cyan, plot=self, antialiased=True
    )
    self.dB3Marker = QwtPlotMarker.make(
        label=QwtText.make(color=Qt.white, brush=Qt.red, weight=QFont.Light),
        linestyle=QwtPlotMarker.VLine,
        align=Qt.AlignRight | Qt.AlignBottom,
        color=Qt.green,
        width=2,
        style=Qt.DashDotLine,
        plot=self,
    )
    self.peakMarker = QwtPlotMarker.make(
        label=QwtText.make(
            color=Qt.red, brush=self.canvasBackground(), weight=QFont.Bold
        ),
        symbol=QwtSymbol.make(QwtSymbol.Diamond, Qt.yellow, Qt.green, (7, 7)),
        linestyle=QwtPlotMarker.HLine,
        align=Qt.AlignRight | Qt.AlignBottom,
        color=Qt.red,
        width=2,
        style=Qt.DashDotLine,
        plot=self,
    )
    QwtPlotMarker.make(
        xvalue=0.1,
        yvalue=-20.0,
        align=Qt.AlignRight | Qt.AlignBottom,
        label=QwtText.make(
            "[1-(\u03c9/\u03c9<sub>0</sub>)<sup>2</sup>+2j\u03c9/Q]"
            "<sup>-1</sup>",
            color=Qt.white,
            borderradius=2,
            borderpen=QPen(Qt.lightGray, 5),
            brush=Qt.lightGray,
            weight=QFont.Bold,
        ),
        plot=self,
    )

    self.setDamp(0.01)

def showData(self, frequency, amplitude, phase):
    self.curve1.setData(frequency, amplitude)
    self.curve2.setData(frequency, phase)

def showPeak(self, frequency, amplitude):
    self.peakMarker.setValue(frequency, amplitude)
    label = self.peakMarker.label()
    label.setText("Peak: %4g dB" % amplitude)
    self.peakMarker.setLabel(label)

def show3dB(self, frequency):
    self.dB3Marker.setValue(frequency, 0.0)
    label = self.dB3Marker.label()
    label.setText("-3dB at f = %4g" % frequency)
    self.dB3Marker.setLabel(label)

def setDamp(self, d):
    self.damping = d
    # Numerical Python: f, g, a and p are NumPy arrays!
    f = np.exp(np.log(10.0) * np.arange(-2, 2.02, 0.04))
    g = 1.0 / (1.0 - f * f + 2j * self.damping * f)
    a = 20.0 * np.log10(abs(g))
    p = 180 * np.arctan2(g.imag, g.real) / np.pi
    # for show3dB
    i3 = np.argmax(np.where(np.less(a, -3.0), a, -100.0))
    f3 = f[i3] - (a[i3] + 3.0) * (f[i3] - f[i3 - 1]) / (a[i3] - a[i3 - 1])
    # for showPeak
    imax = np.argmax(a)

    self.showPeak(f[imax], a[imax])
    self.show3dB(f3)
    self.showData(f, a, p)

    self.replot()
FNAME_PDF = "bode.pdf"
class BodeDemo(QMainWindow): def init(self, *args): QMainWindow.init(self, *args)
    self.plot = BodePlot(self)
    self.plot.setContentsMargins(5, 5, 5, 0)

    self.setContextMenuPolicy(Qt.NoContextMenu)

    self.setCentralWidget(self.plot)

    toolBar = QToolBar(self)
    self.addToolBar(toolBar)

    btnPrint = QToolButton(toolBar)
    btnPrint.setText("Print")
    btnPrint.setIcon(QIcon(QPixmap(print_xpm)))
    btnPrint.setToolButtonStyle(Qt.ToolButtonTextUnderIcon)
    toolBar.addWidget(btnPrint)
    btnPrint.clicked.connect(self.print_)

    btnExport = QToolButton(toolBar)
    btnExport.setText("Export")
    btnExport.setIcon(QIcon(QPixmap(print_xpm)))
    btnExport.setToolButtonStyle(Qt.ToolButtonTextUnderIcon)
    toolBar.addWidget(btnExport)
    btnExport.clicked.connect(self.exportDocument)

    toolBar.addSeparator()

    dampBox = QWidget(toolBar)
    dampLayout = QHBoxLayout(dampBox)
    dampLayout.setSpacing(0)
    dampLayout.addWidget(QWidget(dampBox), 10)  # spacer
    dampLayout.addWidget(QLabel("Damping Factor", dampBox), 0)
    dampLayout.addSpacing(10)

    toolBar.addWidget(dampBox)

    self.statusBar()

    self.showInfo()

    if utils.TestEnvironment().unattended:
        self.print_(unattended=True)

def print_(self, unattended=False):
    try:
        mode = QPrinter.HighResolution
        printer = QPrinter(mode)
    except AttributeError:
        # Some PySide6 / PyQt6 versions do not have this attribute on Linux
        printer = QPrinter()

    printer.setCreator("Bode example")
    printer.setPageOrientation(QPageLayout.Landscape)
    try:
        printer.setColorMode(QPrinter.Color)
    except AttributeError:
        pass

    docName = str(self.plot.title().text())
    if not docName:
        docName.replace("\n", " -- ")
        printer.setDocName(docName)

    dialog = QPrintDialog(printer)
    if unattended:
        # Configure QPrinter object to print to PDF file
        printer.setPrinterName("")
        printer.setOutputFileName(FNAME_PDF)
        dialog.accept()
        ok = True
    else:
        ok = dialog.exec_()
    if ok:
        renderer = QwtPlotRenderer()
        renderer.renderTo(self.plot, printer)

def exportDocument(self):
    renderer = QwtPlotRenderer(self.plot)
    renderer.exportTo(self.plot, "bode")

def showInfo(self, text=""):
    self.statusBar().showMessage(text)

def moved(self, point):
    info = "Freq=%g, Ampl=%g, Phase=%g" % (
        self.plot.invTransform(QwtPlot.xBottom, point.x()),
        self.plot.invTransform(QwtPlot.yLeft, point.y()),
        self.plot.invTransform(QwtPlot.yRight, point.y()),
    )
    self.showInfo(info)

def selected(self, _):
    self.showInfo()
def test_bodedemo(): """Bode demo""" utils.test_widget(BodeDemo, (640, 480)) if os.path.isfile(FNAME_PDF): os.remove(FNAME_PDF)
if name == "main": test_bodedemo()