Curve benchmark demo 1 — PythonQwt 0.14 Manual (original) (raw)
import time
import numpy as np from qtpy.QtCore import Qt from qtpy.QtWidgets import ( QApplication, QGridLayout, QLineEdit, QMainWindow, QTabWidget, QTextEdit, QWidget, )
from qwt import QwtPlot, QwtPlotCurve from qwt.tests import utils
COLOR_INDEX = None
def get_curve_color(): global COLOR_INDEX colors = (Qt.blue, Qt.red, Qt.green, Qt.yellow, Qt.magenta, Qt.cyan) if COLOR_INDEX is None: COLOR_INDEX = 0 else: COLOR_INDEX = (COLOR_INDEX + 1) % len(colors) return colors[COLOR_INDEX]
PLOT_ID = 0
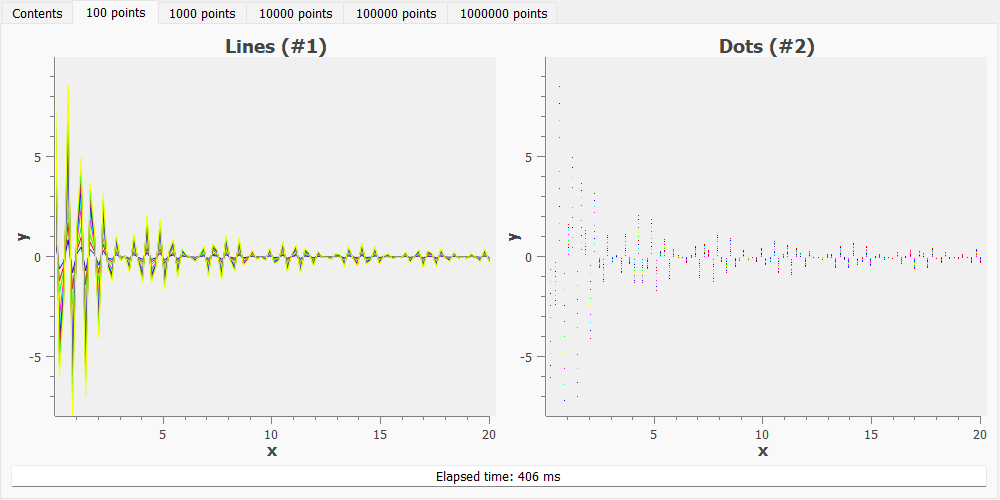
class BMPlot(QwtPlot): def init(self, title, xdata, ydata, style, symbol=None, *args): super(BMPlot, self).init(*args) global PLOT_ID self.setMinimumSize(200, 150) PLOT_ID += 1 self.setTitle("%s (#%d)" % (title, PLOT_ID)) self.setAxisTitle(QwtPlot.xBottom, "x") self.setAxisTitle(QwtPlot.yLeft, "y") self.curve_nb = 0 for idx in range(1, 11): self.curve_nb += 1 QwtPlotCurve.make( xdata, ydata * idx, style=style, symbol=symbol, linecolor=get_curve_color(), antialiased=True, plot=self, ) self.replot()
class BMWidget(QWidget): def init(self, nbcol, points, *args, **kwargs): super(BMWidget, self).init() self.plot_nb = 0 self.curve_nb = 0 self.setup(nbcol, points, *args, **kwargs)
def params(self, *args, **kwargs):
    if kwargs.get("only_lines", False):
        return (("Lines", None),)
    else:
        return (
            ("Lines", None),
            ("Dots", None),
        )

def setup(self, nbcol, points, *args, **kwargs):
    x = np.linspace(0.001, 20.0, int(points))
    y = (np.sin(x) / x) * np.cos(20 * x)
    layout = QGridLayout()
    col, row = 0, 0
    for style, symbol in self.params(*args, **kwargs):
        plot = BMPlot(style, x, y, getattr(QwtPlotCurve, style), symbol=symbol)
        layout.addWidget(plot, row, col)
        self.plot_nb += 1
        self.curve_nb += plot.curve_nb
        col += 1
        if col >= nbcol:
            row += 1
            col = 0
    self.text = QLineEdit()
    self.text.setReadOnly(True)
    self.text.setAlignment(Qt.AlignCenter)
    self.text.setText("Rendering plot...")
    layout.addWidget(self.text, row + 1, 0, 1, nbcol)
    self.setLayout(layout)
class BMText(QTextEdit):
def init(self, parent=None, title=None):
super(BMText, self).init(parent)
self.setReadOnly(True)
library = "PythonQwt"
wintitle = self.parent().windowTitle()
if not wintitle:
wintitle = "Benchmark"
if title is None:
title = "%s example" % wintitle
self.parent().setWindowTitle("%s [%s]" % (wintitle, library))
self.setText(
"""
%s:
(base plotting library: %s)
Click on each tab to test if plotting performance is acceptable in terms of
GUI response time (switch between tabs, resize main windows, ...).
Benchmarks results:
"""
% (title, library)
)
class CurveBenchmark1(QMainWindow): TITLE = "Curve benchmark" SIZE = (1000, 500)
def __init__(self, max_n=1000000, parent=None, unattended=False, **kwargs):
    super(CurveBenchmark1, self).__init__(parent=parent)
    title = self.TITLE
    if kwargs.get("only_lines", False):
        title = "%s (%s)" % (title, "only lines")
    self.setWindowTitle(title)
    self.tabs = QTabWidget()
    self.setCentralWidget(self.tabs)
    self.text = BMText(self)
    self.tabs.addTab(self.text, "Contents")
    self.resize(*self.SIZE)
    self.durations = []

    # Force window to show up and refresh (for test purpose only)
    self.show()
    QApplication.processEvents()

    t0g = time.time()
    self.run_benchmark(max_n, unattended, **kwargs)
    dt = time.time() - t0g
    self.text.append("<br><br><u>Total elapsed time</u>: %d ms" % (dt * 1e3))
    self.tabs.setCurrentIndex(1 if unattended else 0)

def process_iteration(self, title, description, widget, t0):
    self.tabs.addTab(widget, title)
    self.tabs.setCurrentWidget(widget)

    # Force widget to refresh (for test purpose only)
    QApplication.processEvents()

    duration = (time.time() - t0) * 1000
    self.durations.append(duration)
    time_str = "Elapsed time: %d ms" % duration
    widget.text.setText(time_str)
    self.text.append("<br><i>%s:</i><br>%s" % (description, time_str))
    print("[%s] %s" % (utils.get_lib_versions(), time_str))

def run_benchmark(self, max_n, unattended, **kwargs):
    max_n = 1000 if unattended else max_n
    iterations = 0 if unattended else 4
    for idx in range(iterations, -1, -1):
        points = int(max_n / 10**idx)
        t0 = time.time()
        widget = BMWidget(2, points, **kwargs)
        title = "%d points" % points
        description = "%d plots with %d curves of %d points" % (
            widget.plot_nb,
            widget.curve_nb,
            points,
        )
        self.process_iteration(title, description, widget, t0)
def test_curvebenchmark1(): """Curve benchmark example""" utils.test_widget(CurveBenchmark1, options=False)
if name == "main": test_curvebenchmark1()