Really simple demo — PythonQwt 0.14 Manual (original) (raw)
import os
import numpy as np from qtpy.QtCore import Qt, QTimer
import qwt from qwt.tests import utils
FNAMES = ("test_simple.svg", "test_simple.pdf", "test_simple.png")
class SimplePlot(qwt.QwtPlot): NUM_POINTS = 100 TEST_EXPORT = True
def __init__(self):
qwt.QwtPlot.__init__(self)
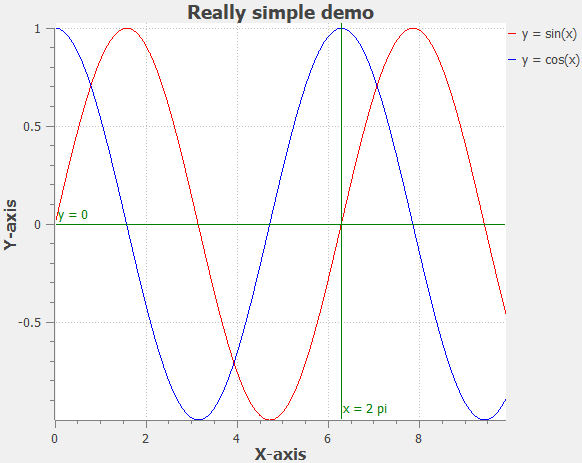
self.setTitle("Really simple demo")
self.insertLegend(qwt.QwtLegend(), qwt.QwtPlot.RightLegend)
self.setAxisTitle(qwt.QwtPlot.xBottom, "X-axis")
self.setAxisTitle(qwt.QwtPlot.yLeft, "Y-axis")
self.enableAxis(self.xBottom)
self.setCanvasBackground(Qt.white)
qwt.QwtPlotGrid.make(self, color=Qt.lightGray, width=0, style=Qt.DotLine)
# insert a few curves
x = np.linspace(0.0, 10.0, self.NUM_POINTS)
qwt.QwtPlotCurve.make(x, np.sin(x), "y = sin(x)", self, linecolor="red")
qwt.QwtPlotCurve.make(x, np.cos(x), "y = cos(x)", self, linecolor="blue")
# insert a horizontal marker at y = 0
qwt.QwtPlotMarker.make(
label="y = 0",
align=Qt.AlignRight | Qt.AlignTop,
linestyle=qwt.QwtPlotMarker.HLine,
color="darkGreen",
plot=self,
)
# insert a vertical marker at x = 2 pi
qwt.QwtPlotMarker.make(
xvalue=2 * np.pi,
label="x = 2 pi",
align=Qt.AlignRight | Qt.AlignTop,
linestyle=qwt.QwtPlotMarker.VLine,
color="darkGreen",
plot=self,
)
if self.TEST_EXPORT and utils.TestEnvironment().unattended:
QTimer.singleShot(0, self.export_to_different_formats)
def export_to_different_formats(self):
for fname in FNAMES:
self.exportTo(fname)def test_simple(): """Simple plot example""" utils.test_widget(SimplePlot, size=(600, 400)) for fname in FNAMES: if os.path.isfile(fname): os.remove(fname)
if name == "main": test_simple()