Vertical plot demo — PythonQwt 0.14 Manual (original) (raw)
import numpy as np from qtpy.QtCore import Qt from qtpy.QtGui import QColor, QPalette, QPen
from qwt import QwtPlot, QwtPlotCurve, QwtPlotMarker, QwtText from qwt.tests import utils
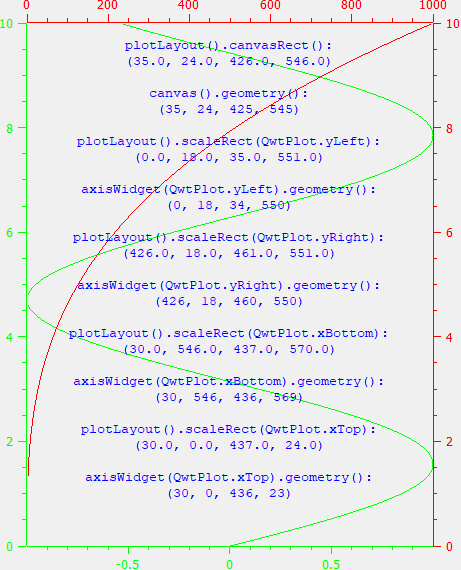
class VerticalPlot(QwtPlot): def init(self, parent=None): super(VerticalPlot, self).init(parent) self.setWindowTitle("PythonQwt") self.enableAxis(self.xTop, True) self.enableAxis(self.yRight, True) y = np.linspace(0, 10, 500) curve1 = QwtPlotCurve.make(np.sin(y), y, title="Test Curve 1") curve2 = QwtPlotCurve.make(y**3, y, title="Test Curve 2") curve2.setAxes(self.xTop, self.yRight)
    for item, col, xa, ya in (
        (curve1, Qt.green, self.xBottom, self.yLeft),
        (curve2, Qt.red, self.xTop, self.yRight),
    ):
        item.attach(self)
        item.setPen(QPen(col))
        for axis_id in xa, ya:
            palette = self.axisWidget(axis_id).palette()
            palette.setColor(QPalette.WindowText, QColor(col))
            palette.setColor(QPalette.Text, QColor(col))
            self.axisWidget(axis_id).setPalette(palette)
            ticks_font = self.axisFont(axis_id)
            self.setAxisFont(axis_id, ticks_font)

    self.marker = QwtPlotMarker.make(0, 5, plot=self)

def resizeEvent(self, event):
    super(VerticalPlot, self).resizeEvent(event)
    self.show_layout_details()

def show_layout_details(self):
    text = (
        "plotLayout().canvasRect():\n%r\n\n"
        "canvas().geometry():\n%r\n\n"
        "plotLayout().scaleRect(QwtPlot.yLeft):\n%r\n\n"
        "axisWidget(QwtPlot.yLeft).geometry():\n%r\n\n"
        "plotLayout().scaleRect(QwtPlot.yRight):\n%r\n\n"
        "axisWidget(QwtPlot.yRight).geometry():\n%r\n\n"
        "plotLayout().scaleRect(QwtPlot.xBottom):\n%r\n\n"
        "axisWidget(QwtPlot.xBottom).geometry():\n%r\n\n"
        "plotLayout().scaleRect(QwtPlot.xTop):\n%r\n\n"
        "axisWidget(QwtPlot.xTop).geometry():\n%r\n\n"
        % (
            self.plotLayout().canvasRect().getCoords(),
            self.canvas().geometry().getCoords(),
            self.plotLayout().scaleRect(QwtPlot.yLeft).getCoords(),
            self.axisWidget(QwtPlot.yLeft).geometry().getCoords(),
            self.plotLayout().scaleRect(QwtPlot.yRight).getCoords(),
            self.axisWidget(QwtPlot.yRight).geometry().getCoords(),
            self.plotLayout().scaleRect(QwtPlot.xBottom).getCoords(),
            self.axisWidget(QwtPlot.xBottom).geometry().getCoords(),
            self.plotLayout().scaleRect(QwtPlot.xTop).getCoords(),
            self.axisWidget(QwtPlot.xTop).geometry().getCoords(),
        )
    )
    self.marker.setLabel(QwtText.make(text, family="Courier New", color=Qt.blue))
def test_vertical(): """Vertical plot example""" utils.test_widget(VerticalPlot, size=(300, 650))
if name == "main": test_vertical()