Plotting #5: Spatial Plotting Functions (original) (raw)
Customizing Plots for Enhanced/Simplified Visualization in Spatial Analyses
While the default plots from Seurat and other packages are often very good they are often modified from their original outputs after plotting. scCustomize seeks to simplify this process and enhance some of the default visualizations.
For this tutorial, I will be utilizing two spatial datasets to illustrate scCustomize functions (both are part of SeuratData package).
In order to be compatible with this vignette we will follow Seurat vignette processing of this data.
# Visium
mouse_ctx <- SCTransform(mouse_ctx, assay = "Spatial", verbose = FALSE)
mouse_ctx <- RunPCA(mouse_ctx, assay = "SCT", verbose = FALSE)
mouse_ctx <- FindNeighbors(mouse_ctx, reduction = "pca", dims = 1:30)
mouse_ctx <- FindClusters(mouse_ctx, verbose = FALSE)
mouse_ctx <- RunUMAP(mouse_ctx, reduction = "pca", dims = 1:30)

# Slide-seq
slide.seq <- SCTransform(slide.seq, assay = "Spatial", ncells = 3000, verbose = FALSE)
slide.seq <- RunPCA(slide.seq)
slide.seq <- RunUMAP(slide.seq, dims = 1:30)
slide.seq <- FindNeighbors(slide.seq, dims = 1:30)
slide.seq <- FindClusters(slide.seq, resolution = 0.3, verbose = FALSE)
Spatial DimPlots
Currently, spatial support in scCustomize is limited to one plotting function SpatialDimPlot. scCustomize provides a matching scCustomize version of the function:SpatialDimPlot_scCustom to align these plots with scCustomize style and colors.
NOTE: If you are interested in further spatial functionality within scCustomize please post issue to GitHub or directly submit PR, as future implementations will be based on user demand.
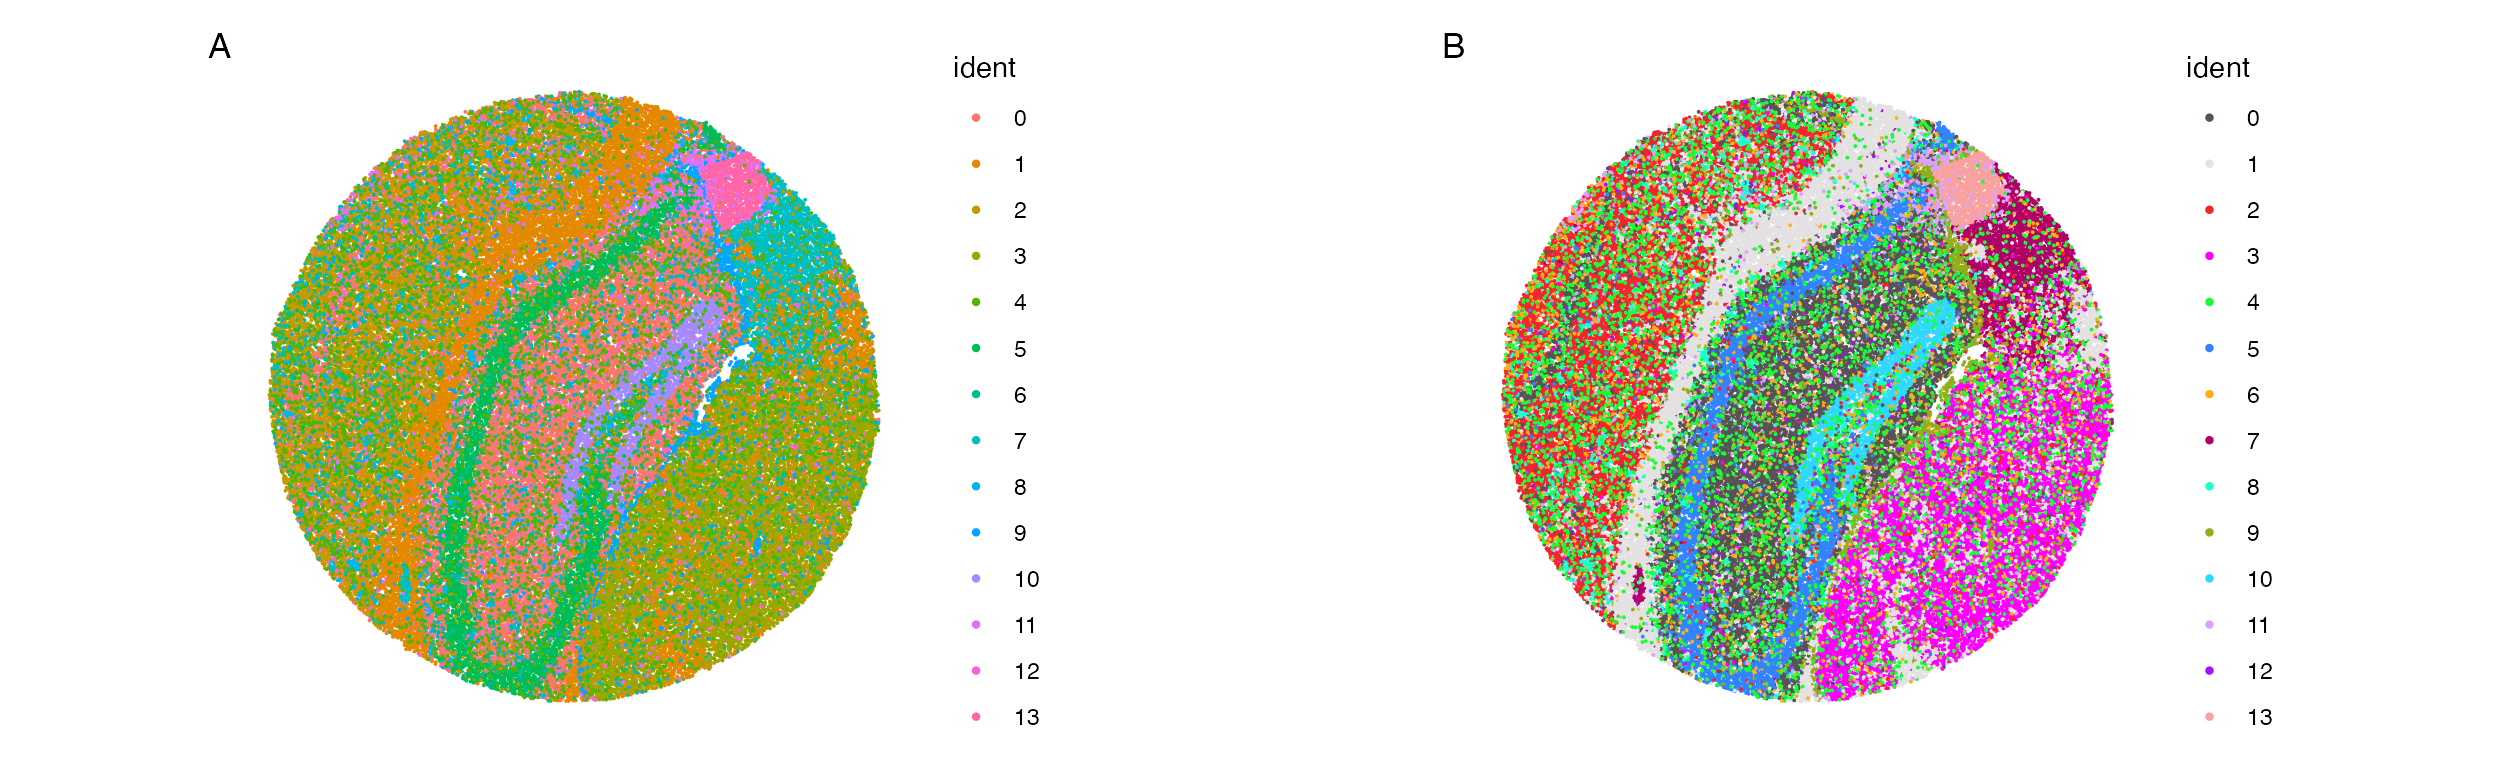
The issue with the default SpatialDimPlot are similar to those affecting the regular DimPlot. Namely that the default color scheme can make it very difficult to tell spot colors from each other. [SpatialDimPlot_scCustom()](../reference/SpatialDimPlot%5FscCustom.html) solves these issues.
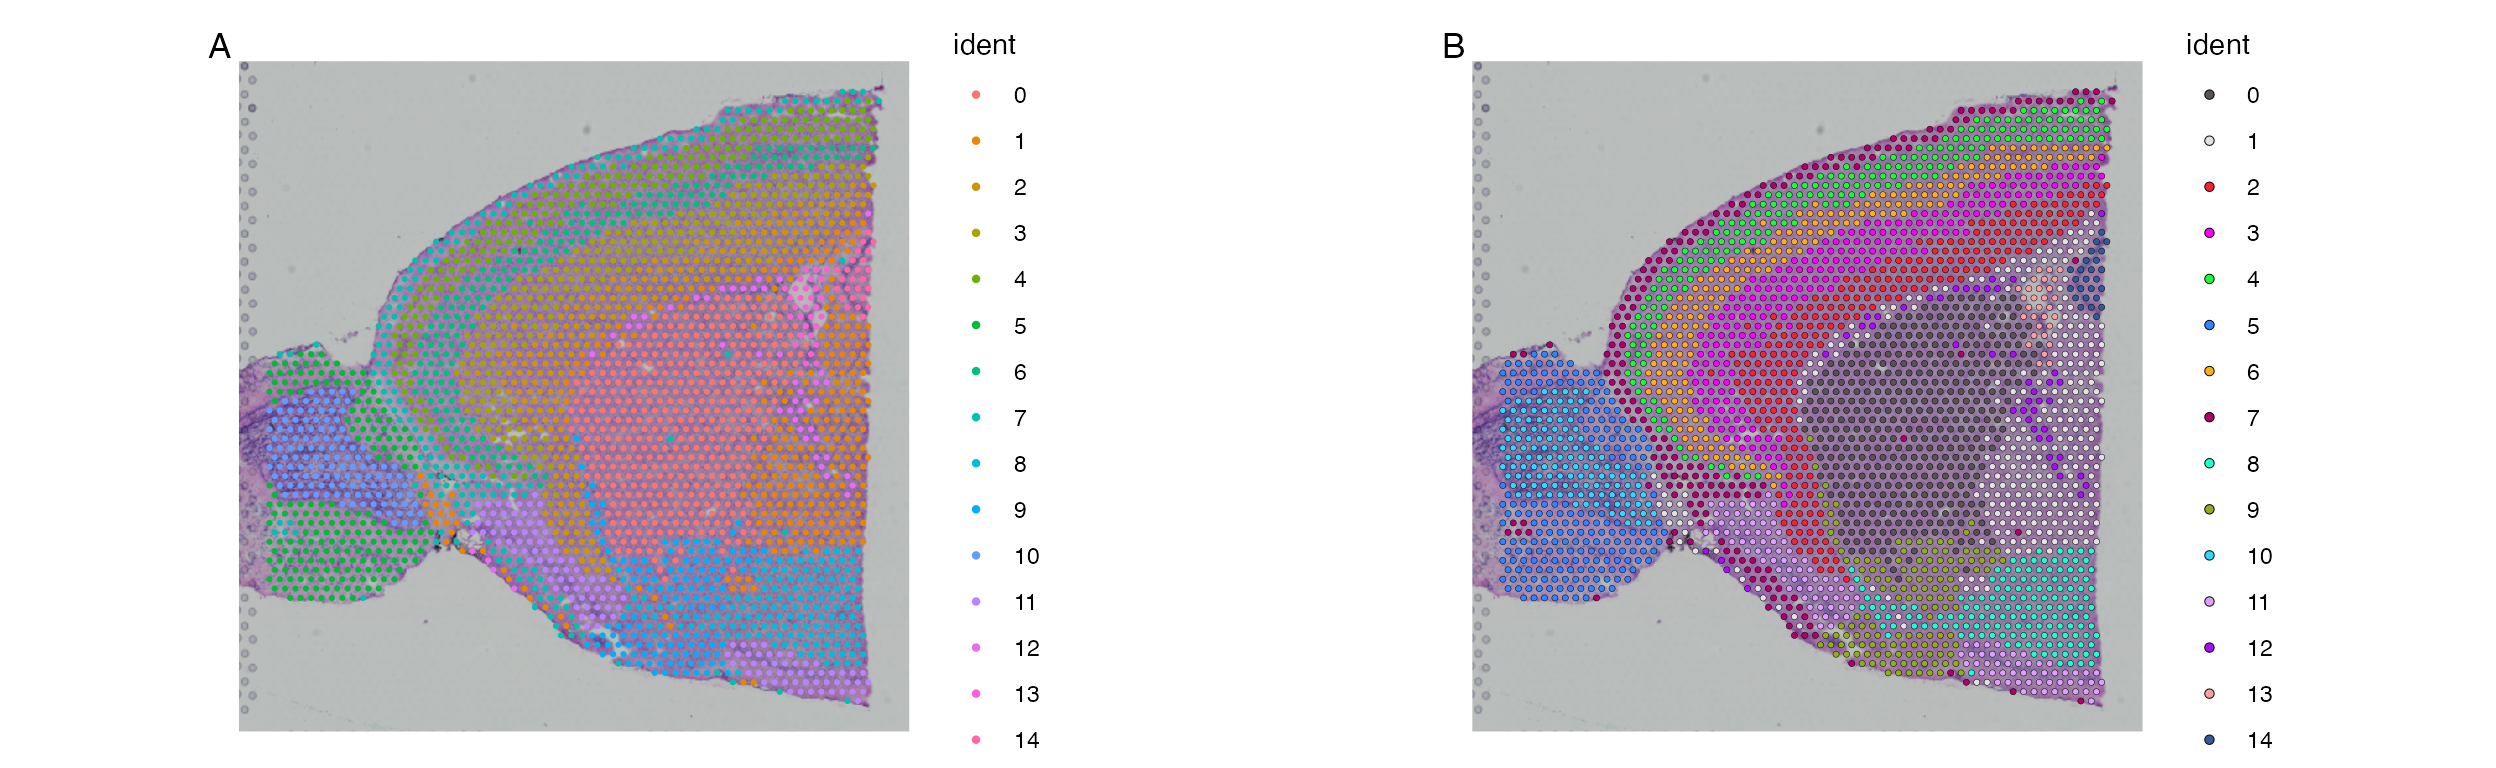
A. Default plotting results in colors that are very similar between clusters making it hard to differentiate between them on the image. B. Default plot using scCustomizeSpatialDimPlotscCustom solves this issues matching color scheme to scCustomize package defaults.