Map data to a normal distribution (original) (raw)
Note
Go to the endto download the full example code. or to run this example in your browser via JupyterLite or Binder
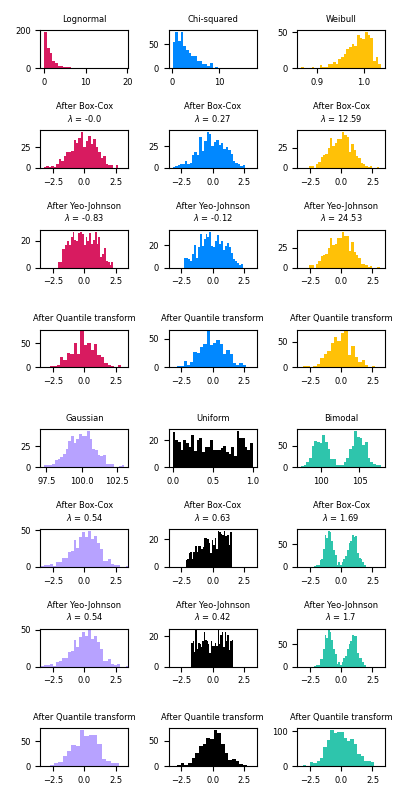
This example demonstrates the use of the Box-Cox and Yeo-Johnson transforms through PowerTransformer to map data from various distributions to a normal distribution.
The power transform is useful as a transformation in modeling problems where homoscedasticity and normality are desired. Below are examples of Box-Cox and Yeo-Johnwon applied to six different probability distributions: Lognormal, Chi-squared, Weibull, Gaussian, Uniform, and Bimodal.
Note that the transformations successfully map the data to a normal distribution when applied to certain datasets, but are ineffective with others. This highlights the importance of visualizing the data before and after transformation.
Also note that even though Box-Cox seems to perform better than Yeo-Johnson for lognormal and chi-squared distributions, keep in mind that Box-Cox does not support inputs with negative values.
For comparison, we also add the output fromQuantileTransformer. It can force any arbitrary distribution into a gaussian, provided that there are enough training samples (thousands). Because it is a non-parametric method, it is harder to interpret than the parametric ones (Box-Cox and Yeo-Johnson).
On “small” datasets (less than a few hundred points), the quantile transformer is prone to overfitting. The use of the power transform is then recommended.
Authors: The scikit-learn developers
SPDX-License-Identifier: BSD-3-Clause
import matplotlib.pyplot as plt import numpy as np
from sklearn.model_selection import train_test_split from sklearn.preprocessing import PowerTransformer, QuantileTransformer
N_SAMPLES = 1000 FONT_SIZE = 6 BINS = 30
rng = np.random.RandomState(304) bc = PowerTransformer(method="box-cox") yj = PowerTransformer(method="yeo-johnson")
n_quantiles is set to the training set size rather than the default value
to avoid a warning being raised by this example
qt = QuantileTransformer( n_quantiles=500, output_distribution="normal", random_state=rng ) size = (N_SAMPLES, 1)
lognormal distribution
X_lognormal = rng.lognormal(size=size)
chi-squared distribution
df = 3 X_chisq = rng.chisquare(df=df, size=size)
weibull distribution
a = 50 X_weibull = rng.weibull(a=a, size=size)
gaussian distribution
loc = 100 X_gaussian = rng.normal(loc=loc, size=size)
uniform distribution
X_uniform = rng.uniform(low=0, high=1, size=size)
bimodal distribution
loc_a, loc_b = 100, 105 X_a, X_b = rng.normal(loc=loc_a, size=size), rng.normal(loc=loc_b, size=size) X_bimodal = np.concatenate([X_a, X_b], axis=0)
create plots
distributions = [ ("Lognormal", X_lognormal), ("Chi-squared", X_chisq), ("Weibull", X_weibull), ("Gaussian", X_gaussian), ("Uniform", X_uniform), ("Bimodal", X_bimodal), ]
colors = ["#D81B60", "#0188FF", "#FFC107", "#B7A2FF", "#000000", "#2EC5AC"]
fig, axes = plt.subplots(nrows=8, ncols=3, figsize=plt.figaspect(2)) axes = axes.flatten() axes_idxs = [ (0, 3, 6, 9), (1, 4, 7, 10), (2, 5, 8, 11), (12, 15, 18, 21), (13, 16, 19, 22), (14, 17, 20, 23), ] axes_list = [(axes[i], axes[j], axes[k], axes[l]) for (i, j, k, l) in axes_idxs]
for distribution, color, axes in zip(distributions, colors, axes_list): name, X = distribution X_train, X_test = train_test_split(X, test_size=0.5)
# perform power transforms and quantile transform
X_trans_bc = bc.fit(X_train).transform(X_test)
lmbda_bc = round(bc.lambdas_[0], 2)
X_trans_yj = yj.fit(X_train).transform(X_test)
lmbda_yj = round(yj.lambdas_[0], 2)
X_trans_qt = qt.fit(X_train).transform(X_test)

ax_original, ax_bc, ax_yj, ax_qt = axes

ax_original.hist(X_train, color=color, bins=BINS)
ax_original.set_title(name, fontsize=FONT_SIZE)
ax_original.tick_params(axis="both", which="major", labelsize=FONT_SIZE)

for ax, X_trans, meth_name, lmbda in zip(
    (ax_bc, ax_yj, ax_qt),
    (X_trans_bc, X_trans_yj, X_trans_qt),
    ("Box-Cox", "Yeo-Johnson", "Quantile transform"),
    (lmbda_bc, lmbda_yj, None),
):
    ax.hist(X_trans, color=color, bins=BINS)
    title = "After {}".format(meth_name)
    if lmbda is not None:
        title += "\n$\\lambda$ = {}".format(lmbda)
    ax.set_title(title, fontsize=FONT_SIZE)
    ax.tick_params(axis="both", which="major", labelsize=FONT_SIZE)
ax.set_xlim([-3.5, 3.5])Total running time of the script: (0 minutes 1.859 seconds)
Related examples