6. Visualizations (original) (raw)
Scikit-learn defines a simple API for creating visualizations for machine learning. The key feature of this API is to allow for quick plotting and visual adjustments without recalculation. We provide Display classes that expose two methods for creating plots: from_estimator andfrom_predictions.
The from_estimator method generates a Display object from a fitted estimator, input data (X, y), and a plot. The from_predictions method creates a Display object from true and predicted values (y_test, y_pred), and a plot.
Using from_predictions avoids having to recompute predictions, but the user needs to take care that the prediction values passed correspond to the pos_label. For predict_proba, select the column corresponding to the pos_label class while for decision_function, revert the score (i.e. multiply by -1) if pos_label is not the last class in theclasses_ attribute of your estimator.
The Display object stores the computed values (e.g., metric values or feature importance) required for plotting with Matplotlib. These values are the results derived from the raw predictions passed to from_predictions, or an estimator and X passed to from_estimator.
Display objects have a plot method that creates a matplotlib plot once the display object has been initialized (note that we recommend that display objects are created via from_estimator or from_predictions instead of initialized directly). The plot method allows adding to an existing plot by passing the existing plotsmatplotlib.axes.Axes to the ax parameter.
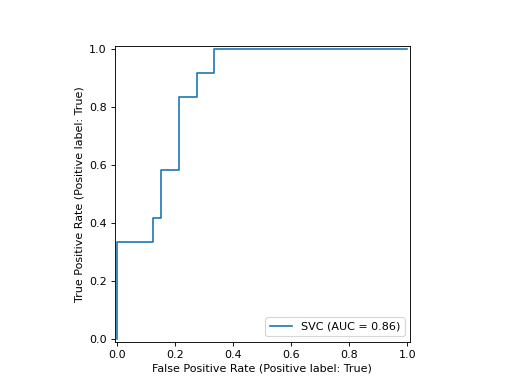
In the following example, we plot a ROC curve for a fitted Logistic Regression model from_estimator:
from sklearn.model_selection import train_test_split from sklearn.linear_model import LogisticRegression from sklearn.metrics import RocCurveDisplay from sklearn.datasets import load_iris
X, y = load_iris(return_X_y=True) y = y == 2 # make binary X_train, X_test, y_train, y_test = train_test_split( X, y, test_size=.8, random_state=42 ) clf = LogisticRegression(random_state=42, C=.01) clf.fit(X_train, y_train)
clf_disp = RocCurveDisplay.from_estimator(clf, X_test, y_test)
If you already have the prediction values, you could instead usefrom_predictions to do the same thing (and save on compute):
from sklearn.model_selection import train_test_split from sklearn.linear_model import LogisticRegression from sklearn.metrics import RocCurveDisplay from sklearn.datasets import load_iris
X, y = load_iris(return_X_y=True) y = y == 2 # make binary X_train, X_test, y_train, y_test = train_test_split( X, y, test_size=.8, random_state=42 ) clf = LogisticRegression(random_state=42, C=.01) clf.fit(X_train, y_train)
select the probability of the class that we considered to be the positive label
y_pred = clf.predict_proba(X_test)[:, 1]
clf_disp = RocCurveDisplay.from_predictions(y_test, y_pred)
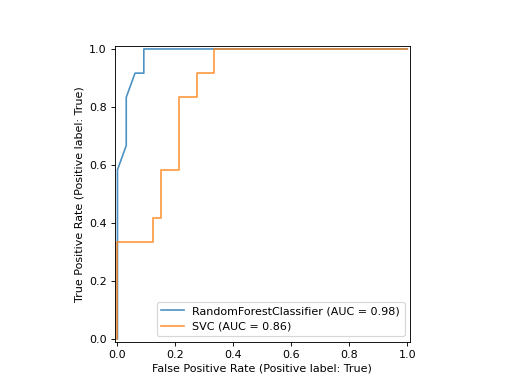
The returned clf_disp object allows us to add another curve to the already computed ROC curve. In this case, the clf_disp is a RocCurveDisplaythat stores the computed values as attributes called roc_auc, fpr, and tpr.
Next, we train a random forest classifier and plot the previously computed ROC curve again by using the plot method of the Display object.
import matplotlib.pyplot as plt from sklearn.ensemble import RandomForestClassifier
rfc = RandomForestClassifier(n_estimators=10, random_state=42) rfc.fit(X_train, y_train)
ax = plt.gca() rfc_disp = RocCurveDisplay.from_estimator( rfc, X_test, y_test, ax=ax, curve_kwargs={"alpha": 0.8} ) clf_disp.plot(ax=ax, curve_kwargs={"alpha": 0.8})
Notice that we pass alpha=0.8 to the plot functions to adjust the alpha values of the curves.
Examples
- ROC Curve with Visualization API
- Advanced Plotting With Partial Dependence
- Visualizations with Display Objects
- Comparison of Calibration of Classifiers