Analyze objects in the JVM heap | IntelliJ IDEA (original) (raw)
When debugging, you can use the Memory tab to review the objects in the heap. IntelliJ IDEA lets you track individual class instances and analyze the conditions that cause objects to spawn or be retained.
This information is useful for detecting memory leaks and their causes. Sometimes, code examination alone might not provide clues, as some errors are easy to overlook. For example, inner classes may prevent the outer classes from becoming eligible for garbage collection, which may eventually result in an OutOfMemoryError. In such cases, combining the Memory tab with the Show Referring Objects option lets you easily find the leak.
Also, examining the memory usage helps you better understand what is going on under the hood and optimize the program by minimizing the creation of unnecessary objects.
Hide/show Memory tab
- Click
 in the top-right corner of the Debug tool window, then click Memory.
The Memory tab shows the following information:
- Class: the name of the class
- Count: the number of class instances (objects) in the heap
- Diff: the difference in the number of instances between two execution points
Get the information on the number of objects
- Stop at a breakpoint or manually suspend the program.
- In the Memory tab, click Load classes (for performance, the Memory tab only collects the data on demand).
The list of all loaded classes appears on the Memory tab. The number of corresponding live objects is shown in the Count column.
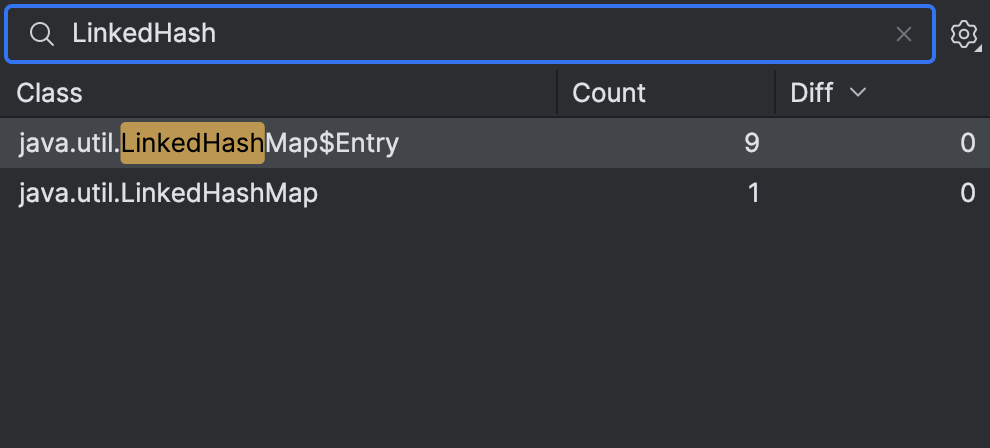
Sort and find classes
- To sort the classes, click the corresponding header (Class, Count, or Diff). Clicking the already selected criterion changes the order (ascending/descending).
- To find a class, start typing its name. The filter will be applied dynamically as you type.
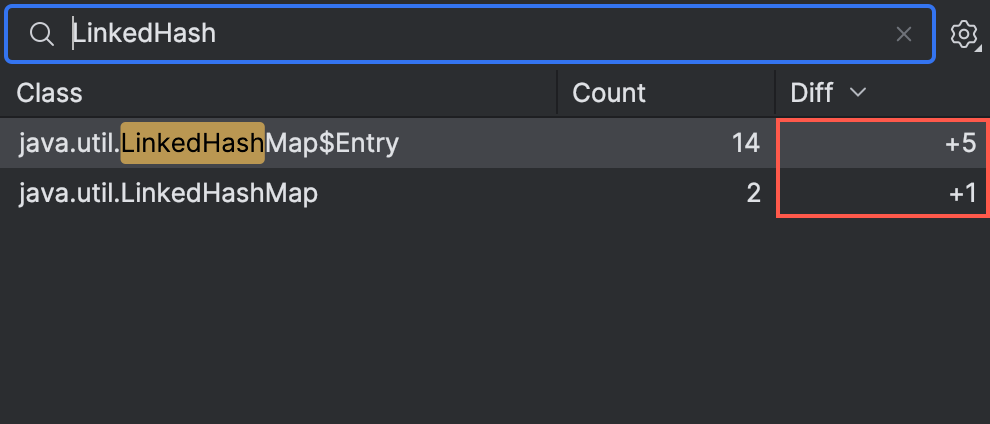
Get the diff between two execution points
Sometimes it is useful to know how many objects have been created since some point. For this, you can collect the information twice and compare it using the built-in Diff feature.
- Collect instances data at the starting point.
- Resume the program execution or step through the code.
- Collect instances data at the second point. The Diff column shows if the number of instances has changed.
View instances
- Double-click a class on the Memory tab.
A dialog opens that lists all live instances of the selected class. You can explore the contents of each object and filter the list using a condition.
For example, to get the list of all emptyStringobjects, double-click String on the Memory tab and enterthis.isEmpty()in the Condition field.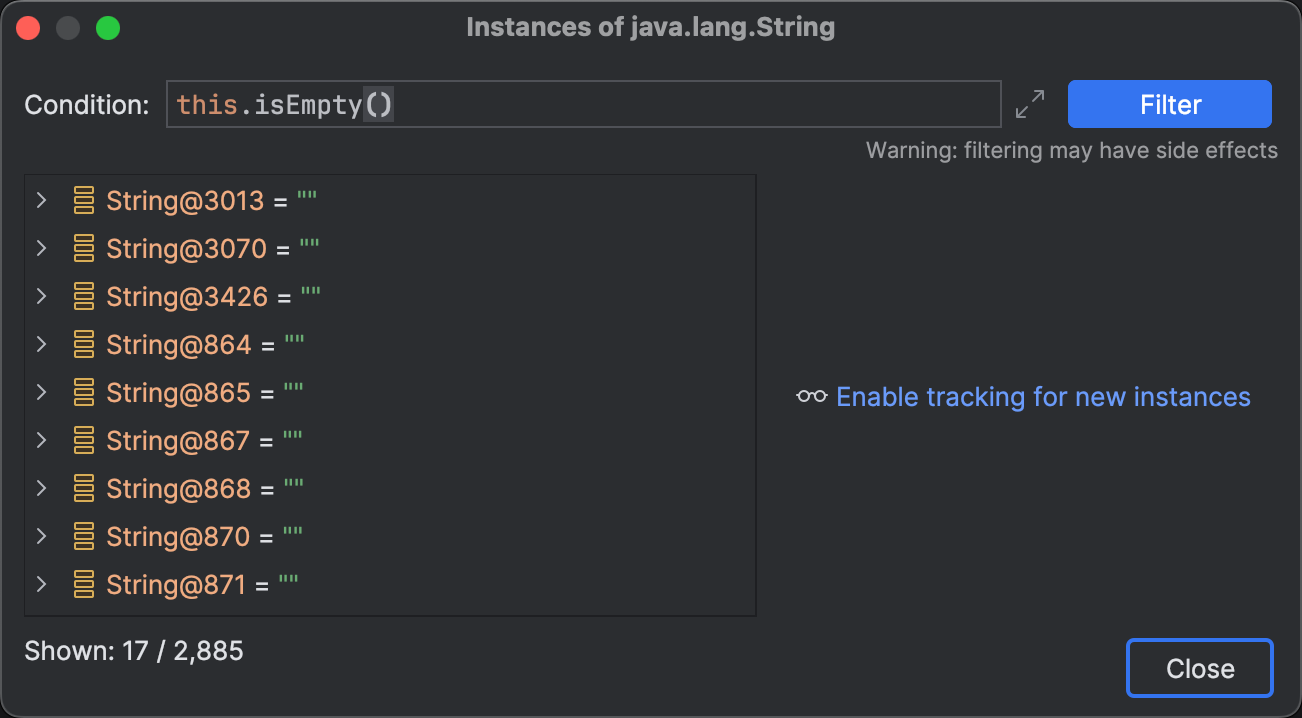
Calculate retained size
For each class instance, you can calculate its retained size. Retained size is the amount of memory that the object itself occupies together with all the objects it refers to and that are not referenced by other objects.
This can be useful when estimating the memory footprint of classes or their specific instances. Also, this can be useful when making a decision on which data structure to use (for example, ArrayList vs. LinkedList).
- Prior to running the application, make sure that the Attach memory agent option is enabled in .
- When viewing instances of a class, right-click an instance and click Calculate Retained Size.
Track new instances
In addition to getting the number of instances, you can record which particular instances were created and where in the call stack that happened.
- Right-click a class and select Track new instances.
The Memory tab will now store the information on the instances of the selected class created after this moment. When there are new instances, their number will appear in parentheses in the Diff column. - To view the list of new instances, click the number in the Diff column. In the dialog that opens, you can explore the contents of each object and see the stack trace of the thread where the corresponding constructor was called.
Customize the view
The options in Memory View Settings  let you customize the way the Memory tab operates:
- To hide the classes that don't have any instances, use the Show with Instances Only option. By default, the Memory tab shows all loaded classes regardless of whether they have been instantiated.
- If you are only interested in the objects whose number of instances has changed, click and select Show Non-Zero Diff Only. This removes all the objects whose total number remained the same.
- To hide the classes whose new instances you are not tracking, use the Show tracked classes only option.
- To allow the Memory tab to track new instances of the selected classes even when it is hidden, use the Enable Tracking with Hidden Memory View option. This option may add some overhead to the debugged application.
- If you want the Memory tab to collect data every time the program is suspended (without requiring you to click Load classes), use the Update Loaded Classes on Debugger Stop option. This feature may add overhead and thus impact stepping performance.
Last modified: 23 October 2024