Frames | PyCharm (original) (raw)
The Frames pane of the Threads&Variables tab enables you to gain access to the list of threads of your application.
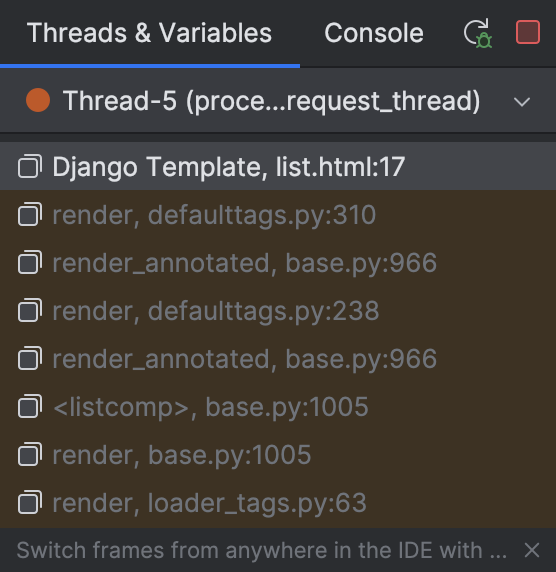
To examine a thread, select it from the list on top of the pane. The status and type of a thread is indicated by a special icon and a textual note next to the thread's name. For each thread, you can view the stack frame, examine frames, navigate between frames, and automatically jump to a frame's source code in the editor.
To examine the values stored in a frame, use the Variables pane of the Debug tool window.
Thread Icons
Icons near each thread indicate the status of the thread:
| Icon | Description |
|---|---|
 |
The current thread in suspended state. |
 |
An active thread. |
 |
The thread that has hit the current breakpoint. |
 |
A suspended thread. Threads are marked as suspended when they were paused by the debugger. |
 |
A frozen thread. Threads are marked as frozen when they were manually paused. |
Last modified: 26 May 2024