Viewing code coverage results | PyCharm (original) (raw)
Viewing code coverage helps you detect pieces of your source code that are not affected by simulation.
View code coverage results
- Do one of the following:
- Run the desired class with coverage, select suite to show, and open class in the editor.
- In the main menu, go to Ctrl+Alt+F6.
- View coverage results:
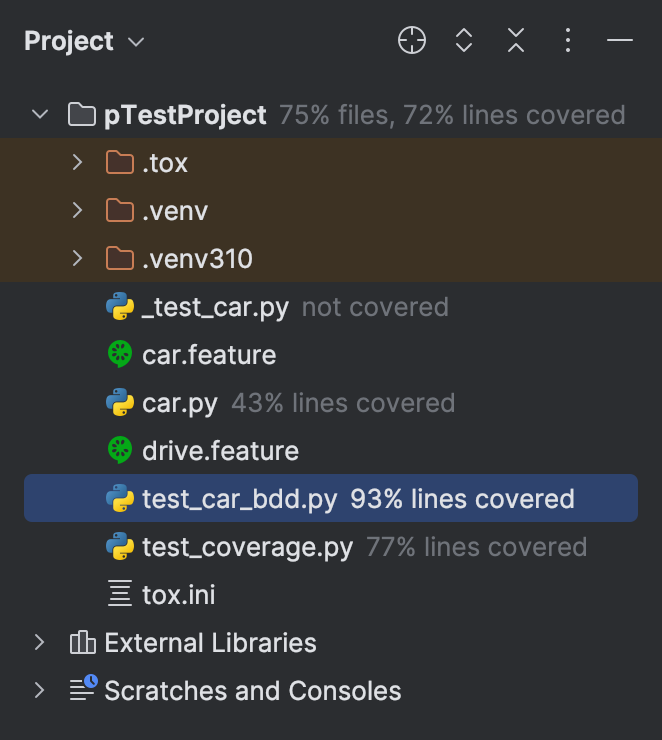
- In the Project tool window:
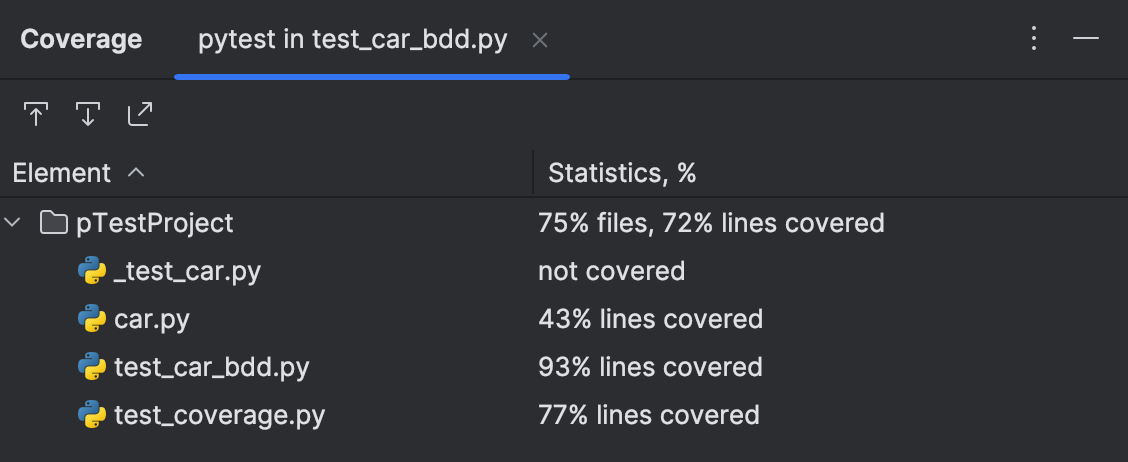
- In the dedicated Coverage tool window:
- In the Project tool window:
- Open in the editor the files you want to explore.
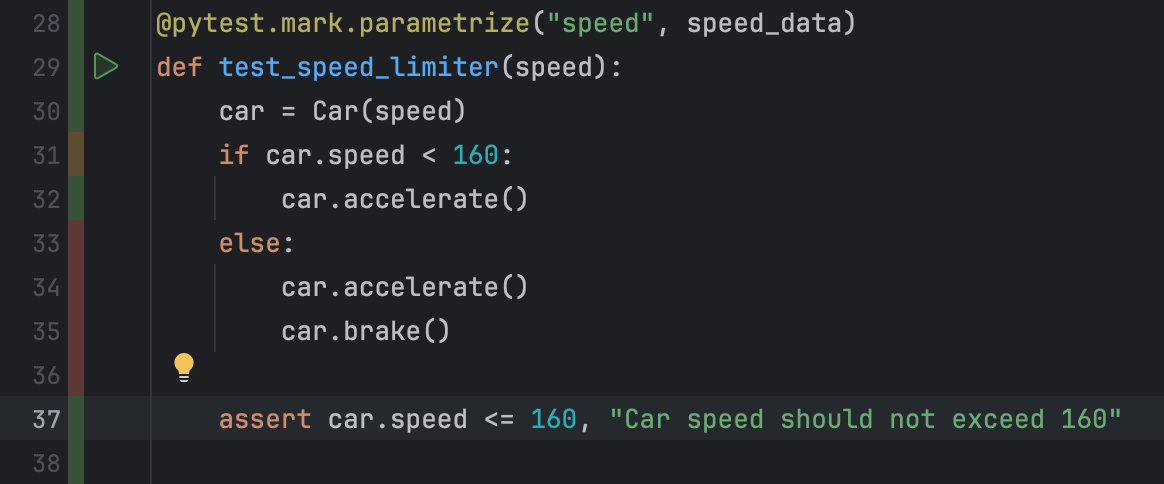
- Use the color indicators in the gutter to detect the uncovered lines of code.
- To find out if a line has been hit, click the line in the gutter area.
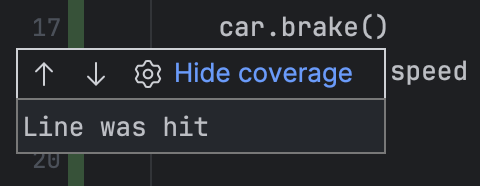
The popup that opens shows the statistic for the line at caret. For lines with conditions, the popup also provides statistics: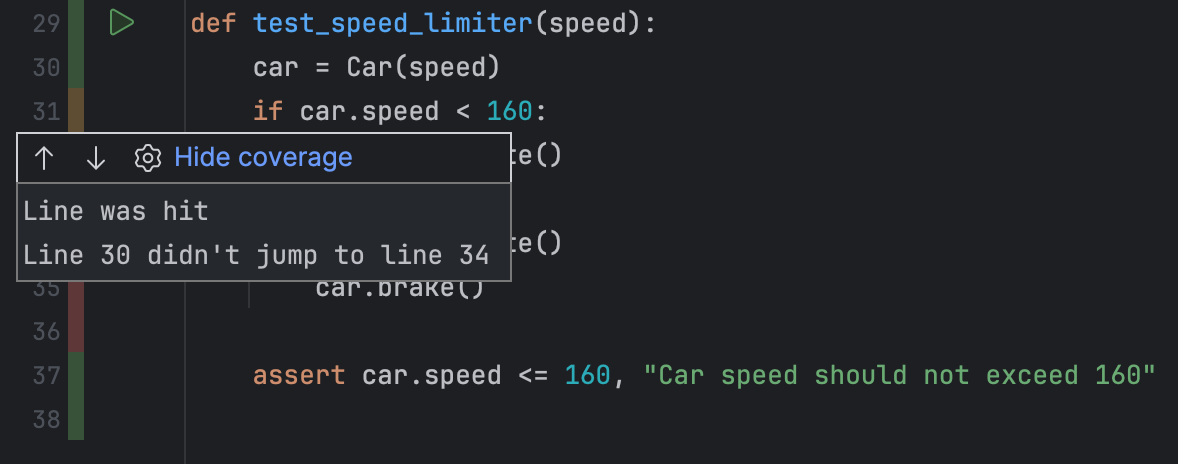
Use the following toolbar buttons:
 : jump to the next/previous groups of covered or uncovered lines.
  : open the Color Scheme
settings, where you have to choose the node Line Coverage.
- Create missing tests, as described in the section Create tests Creating JavaScript Unit Tests.
For JavaScript, tests can be generated as described in the Creating JavaScript Unit Tests section.
Last modified: 17 February 2025