Using interactive Debugger Console | WebStorm (original) (raw)
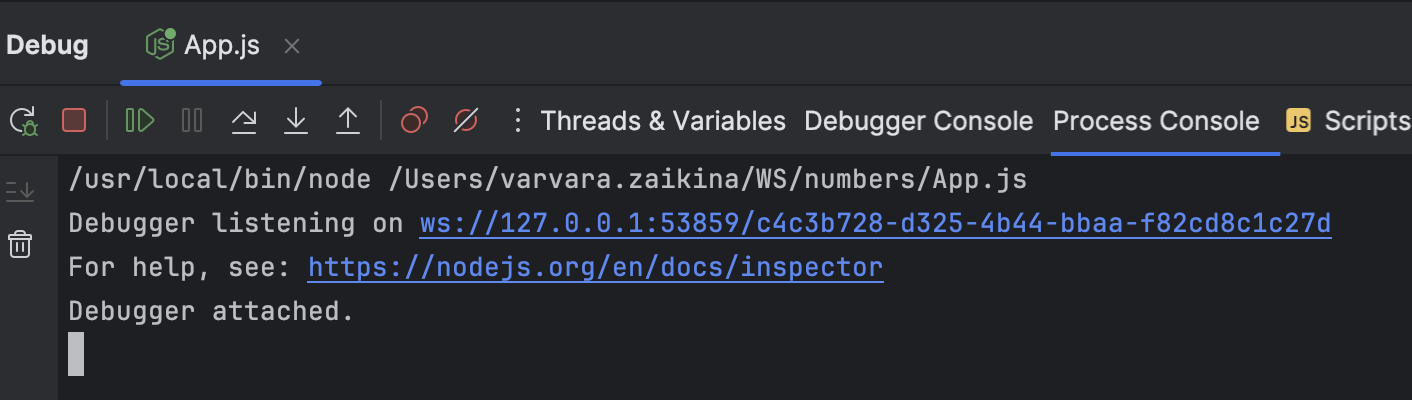
When you are debugging a Node.js application, WebStorm shows two console tabs in the Debug tool window - Process Console and Debugger Console.
- The Process Consoletab shows the output of the node process itself, that is, everything that is written to process.stdout and process.stderr directly or is logged using console.*.
- In the Debugger Console, you can run JavaScript code snippets and view the console.* messages.
Run JavaScript in the Debugger Console
- Start typing a statement at
>in the input field. As you type, WebStorm suggests variants for completion. - Select the relevant statement and press Enter. WebStorm shows its value in the debugger console.
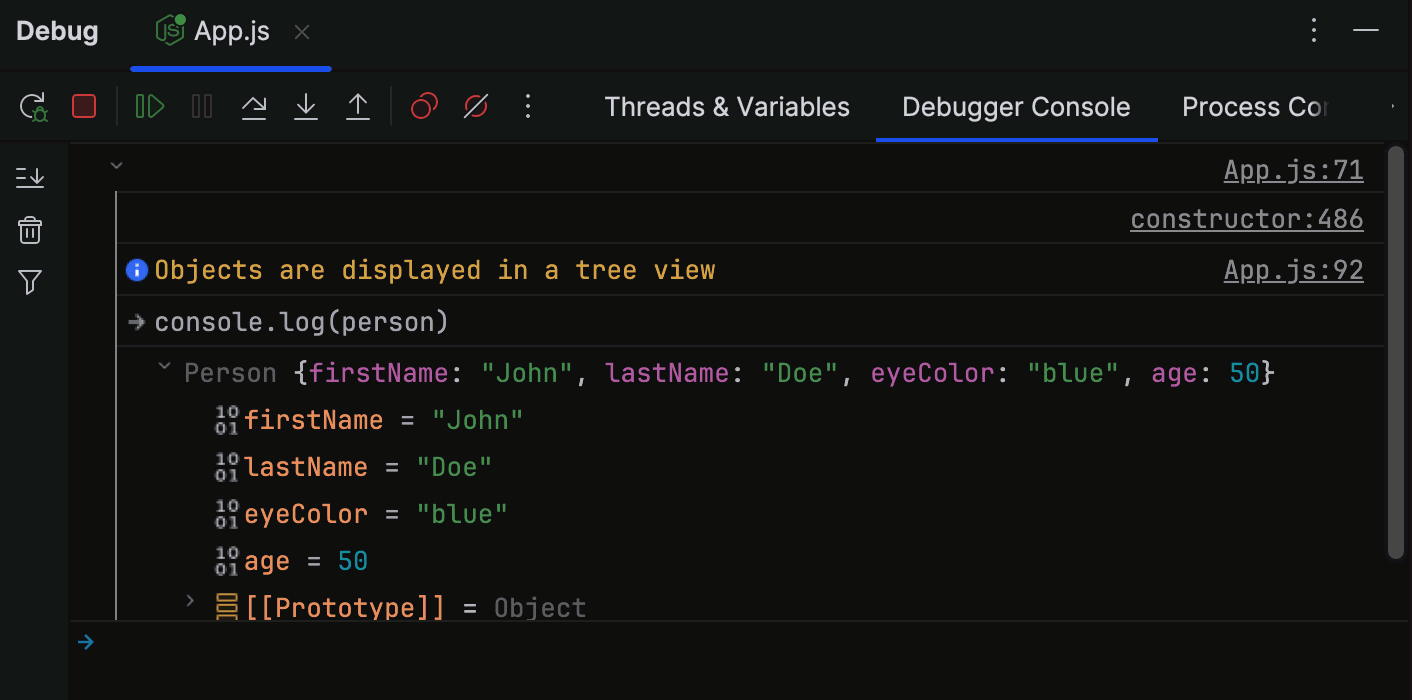
WebStorm shows previews for objects, so you do not need to expand them. If you still expand an object, you get an overview of just its own properties, the__proto__contents are hidden by default.
Navigate to source code
- At each line with output of
console.*, WebStorm shows the name of the file and the line where it was called. Click this link to jump to the call in the source code.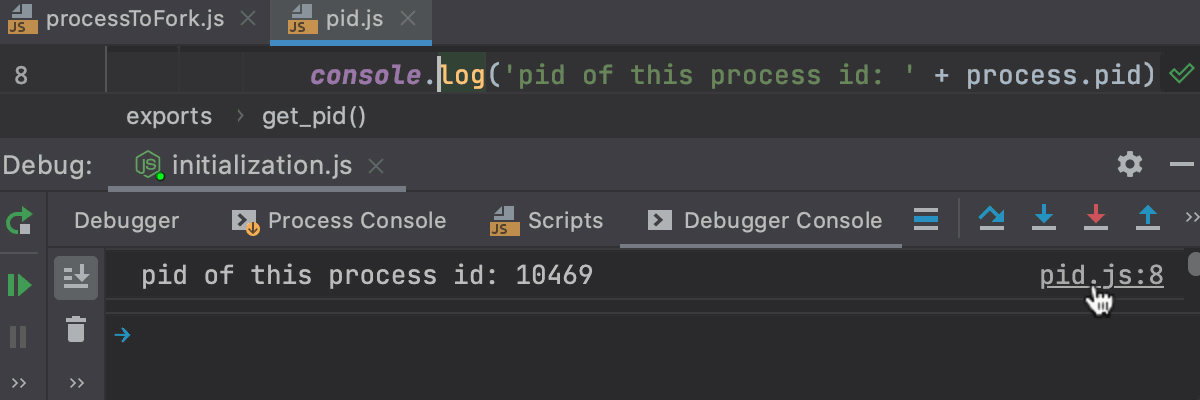
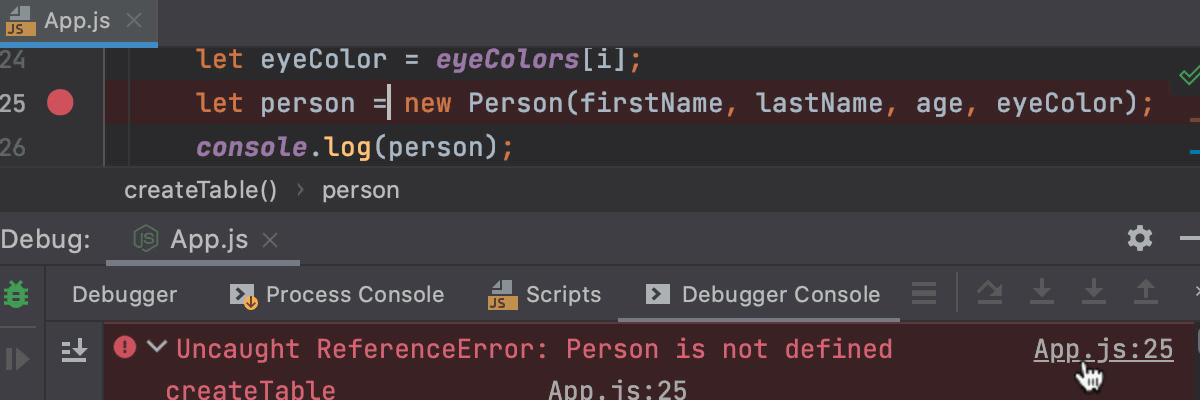
- The Debugger Console also shows stack traces. Click the link next to a reported problem to jump to the line of code where this problem occurred.
Filter out messages
The Debugger Console tab shows objects in a tree view, with stack traces collapsed by default. Warnings console.warn(), errors console.error(), and info console.info() messages have different icons and background colors to make them easier to notice.
- To hide log messages of specific types, click
 and select the severities to filter out.
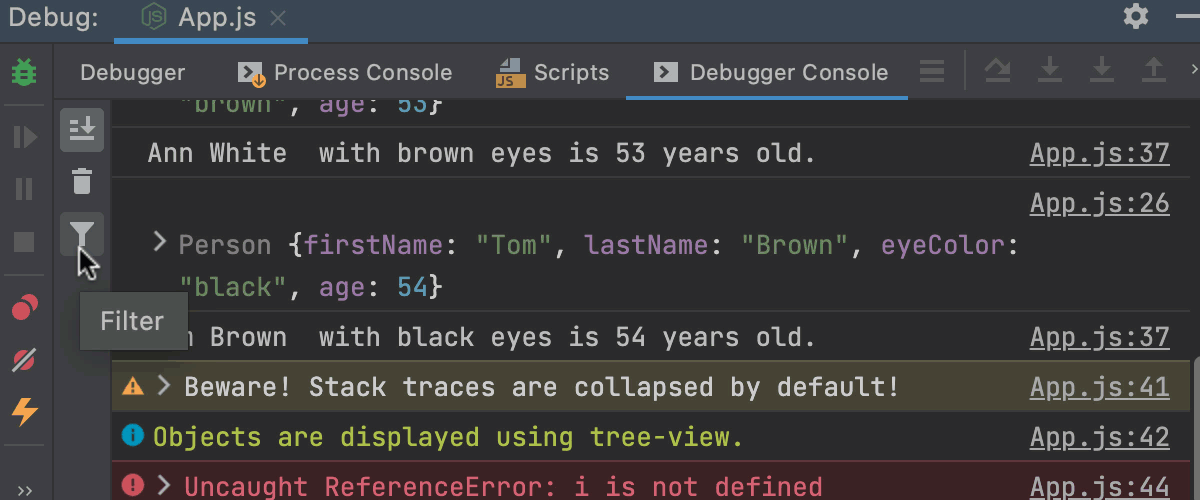
Group messages
- The log messages grouped using
console.group()andconsole.groupEnd()are displayed as a tree. To show the output collapsed by default, useconsole.groupCollapsed().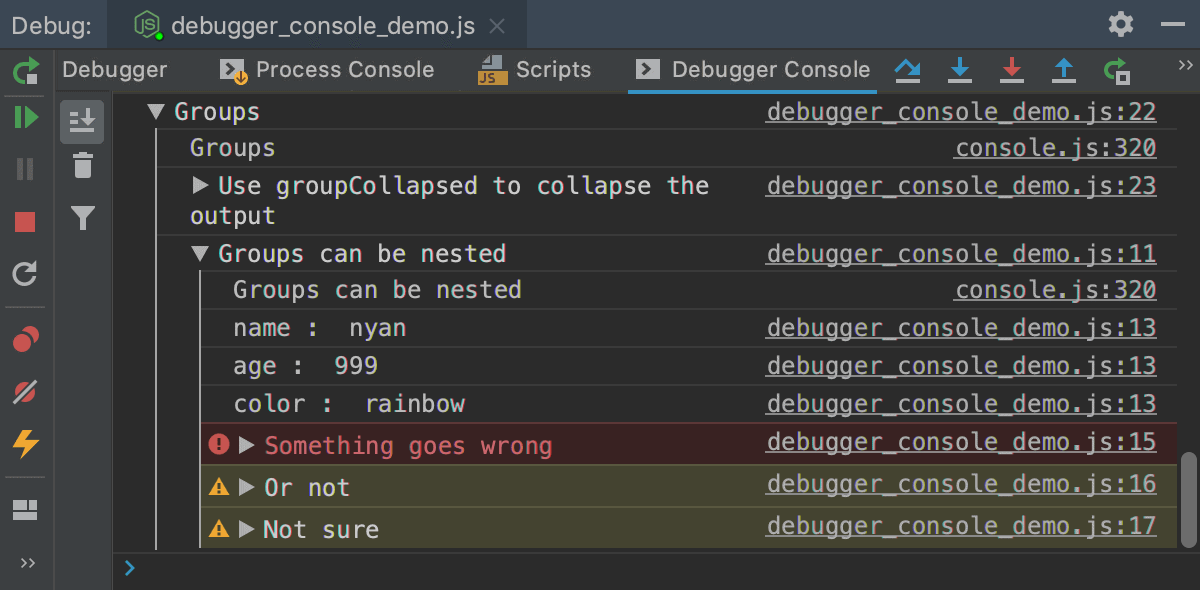
Apply CSS styles
- Use CSS and the
%cmarker to apply styles to log messages.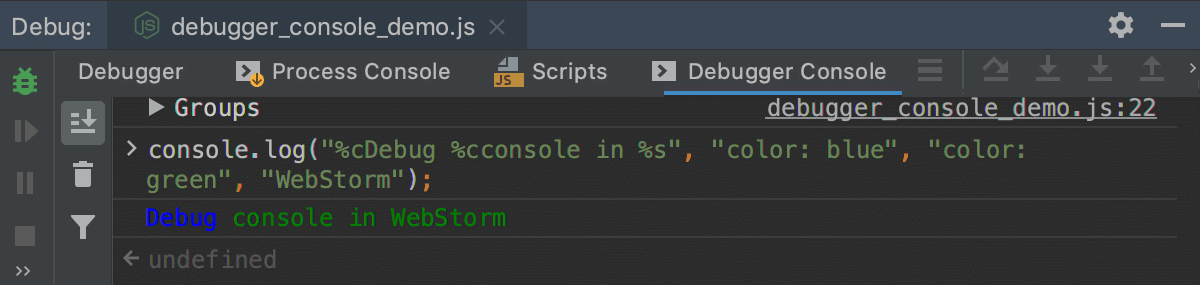
For more information, refer to Styling console output with CSS.
Last modified: 03 September 2024