Configure Spectrum Analyzer - MATLAB & Simulink (original) (raw)
When you use the spectrumAnalyzer object in MATLAB® or the Spectrum Analyzer block in Simulink®, you can configure many settings and tools from the interface. These sections show you how to use the Spectrum Analyzer interface and the tools available.
Signal Display
These figures highlight the important aspects of the Spectrum Analyzer window in MATLAB.
View Type Set to Spectrum
View Type Set to Spectrogram
This figure highlights the simulation controls you see in the Simulink version of the Spectrum Analyzer window.
- Toolstrip
The Spectrum Analyzer toolstrip is located at the top of the Spectrum Analyzer window and contains all the settings and controls. Use these settings to control the Spectrum Analyzer display.
The toolstrip contains these tabs:- Scope Tab –– Control the spectrum and spectrogram display settings.
- Estimation Tab –– Control the settings related to spectral estimation.
- Measurements Tab –– Control the signal measurements.
- Spectrum Tab –– Control trace and scale options for the spectrum view.
- Spectrogram Tab –– Control trace and scale options for the spectrogram view.
- Spectral Mask Tab –– Configure upper and lower limits for the spectral mask.
- Channel Measurements Tab –– Control the channel measurements.
Use the pin button to keep the toolstrip showing or the arrow button
  to hide the toolstrip.
- Legend –– If the input signal has multiple channels, the scope uses an index number to identify each channel of the signal. For example, the legend for a two-channel signal displays the default names as
Channel 1andChannel 2. To show the legend, on theScope tab, clickLegend.
By default, the axes background in the scope is black, and the scope chooses line colors for each channel in a manner similar to the Scope (Simulink) block. When the axes background is black, the scope assigns each channel of each input signal a line color in the order shown in the legend.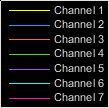
If there are more than seven channels, then the scope repeats this order when assigning line colors to the remaining channels. When the axes background is a color other than black, the scope assigns line colors in this order.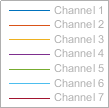
To choose line colors or background colors, on theScope tab, clickSettings ( ). Under Color and Styling, use Background to change the background color of the scope, and Axes to change the background of the plot. Click Line to choose channel, and Color to change the line color of the selected channel.
 - Title, Y-Label, Y-Limits,Color Limits — You can customize the title, y-axis label, y-axis limits, and the color limits (in spectrogram view) from Settings or by using the
Title,YLabel,YLimits, andColorLimitsproperties.
The _x_-axis is always a frequency axis. The x-axis label is therefore eitherFrequency (Hz)orFrequency (kHz). - Min X-Axis, Max X-Axis –– Spectrum Analyzer determines the_x_-axis limits based on the value of the
FrequencySpanproperty in the spectrumAnalyzer object or the SpectrumAnalyzerBlockConfiguration object (in case of the block). To change the _x_-axis limits in the Spectrum Analyzer interface, click the Estimation tab, in the Frequency Options section, select an option from Frequency Span. - Display Controls –– To scale the plot axes, use the mouse to pan around the axes and the scroll button on your mouse to zoom in and out of the plot. Additionally, you can use the buttons that appear when you hover over the plot window.
 — Maximize the axes, hiding all labels and insetting the axes values.
  — Zoom in on the plot.
  — Pan the plot.
  — Autoscale the axes to fit the shown data.
- Status — Provides the current status of the plot. The status can be:
Processing
* Object –– Occurs after you run the object and before you run the release function
* Block –– Occurs during simulation.Stopped
* Object –– Occurs after you callrelease.
* Block –– Occurs before and after the simulationReady
* Object –– Occurs after you construct the scope object and before you first call the object.
* Block –– Occurs after you open the scope and before you first run a simulation.Paused
* Block –– Occurs when you pause the simulation.
- Status Bar –– The status bar shows several signal display properties and the display time.
For the scope to display these properties in the status bar, right-click the status bar and select the properties in the Customize Status Bar window. For more details on these properties, refer to thespectrumAnalyzer object and the Spectrum Analyzer block pages.
Display Time –– The display time is the amount of time that has progressed since the last update to the Spectrum Analyzer display.
Every time you call the scope, the simulation time increases by the number of rows in the input signal divided by the sample rate, as given by this equation:
At the beginning of a simulation, you can modify the Sample Rate (Hz) parameter on the Scope tab of the Spectrum Analyzer toolstrip. You can also set the sample rate using theSampleRateproperty in thespectrumAnalyzer object or the SpectrumAnalyzerBlockConfiguration object (in case of the block). The display time is updated each time the display is updated.
The Spectrum Analyzer status bar can further display one of these:- Frames processed
- Samples processed
- Spectrum updates processed
When you enable the spectrogram display, you can show the name of the spectrogram channel in the status bar by selecting Spectrogram Channel.
Scope Tab
The Scope tab contains these sections.
- Views –– Choose to view a spectrum, a spectrogram, or both. You can select the type of spectrum by clicking the Spectrum drop-down and selecting one of the options. The Spectrum Analyzer updates the display accordingly.
- Bandwidth –– Specify the sample rate, RBW, and the frequency offset for the frequency axis (_x_-axis).
- Configuration –– Modify the Spectrum Analyzer settings, enable the legend and colorbar (for spectrogram display), and set the display layout.
- Share –– Save the Spectrum Analyzer for future use or share it with others using the buttons in theShare section of the Scope tab.
- (Object only) Generate Script –– Generate a MATLAB script to create a Spectrum Analyzer with the current settings. For more information on generating a script, see generateScript.
- Copy to Clipboard –– Copy the display to your clipboard. You can paste the image in another program to save or share.
- Preserve Colors –– Preserve colors while copying to the clipboard.
- Print –– Opens a print dialog box from which you can print out the plot image.
- Snapshot — During a simulation, use the Snapshot button to pause the visualization at an interesting point so you can take a screenshot of the Spectrum Analyzer window.
Estimation Tab
The Estimation tab contains these sections.
- Domain –– Select the domain of the input signal that you want to visualize.
- Frequency Resolution –– Select the spectral estimation method as
Filter bankorWelch. For more information on these methods, see Algorithms in thespectrumAnalyzerobject page. - Averaging –– Select the method of averaging the power spectral estimate as
VBW(video bandwidth) orExponential. For more details, see Averaging Method. - Frequency Options –– Select the frequency span. This property determines the_x_-axis (frequency axis) limits in the display.
- Window Options –– When you set the spectral estimation method to
Welch, the Spectrum Analyzer uses the Welch's method of averaged modified periodogram. For more details on this method, see Spectrum Estimation — Welch's Method. In this technique, the algorithm applies a window to the time-domain data before computing FFT and the power spectrum estimate.
You can select the window and specify the corresponding window options.
Measurements Tab
The Measurements tab contains these sections.
- Channel –– Select the channel for which you want the Spectrum Analyzer to display the measurements.
- Cursors –– Enable Data Cursors in the display. For more information, see Cursor Measurements.
- Peaks –– Enable Peak Finder to display the largest peak values. You can specify the number of peaks, minimum height of the peaks, minimum distance between peaks, and label the peaks. For more information, see Peak Finder Measurements.
- Distortion –– EnableDistortion to compute and display the harmonic and intermodulation distortion measurements. For more information, seeDistortion Measurements.
Spectrum Tab
To enable the Spectrum tab, in the Scope tab, in the Views section, clickSpectrum.
The Spectrum tab contains these sections.
- Trace Options –– Choose to display a two-sided spectrum or a one-sided spectrum, and select to show maximum-hold trace, minimum-hold trace, or normal trace.
- Scale –– Specify reference load and spectrum units.
Spectrogram Tab
To enable the Spectrogram tab, in theScope tab, in the Views section, clickSpectrogram.
In addition to the trace and scale options, the Spectrogram tab also contains Time Options. In the Time Options section, you can specify the time resolution for each spectrogram line and the time span of the spectrogram display.
Spectral Mask Tab
To enable the Spectral Mask tab, in theScope tab, in the Views section, clickSpectrum, and select eitherPower or Power Density in the spectrum drop-down options.
Enable to show upper and lower masks in the Spectrum Analyzer. You can specify the upper and lower limits of the mask, and select the channel over which the Spectrum Analyzer applies the mask. For more information, see Spectral Mask.
Channel Measurements Tab
To enable the Channel Measurements tab, in theScope tab, in the Views section, clickSpectrum. Use the Channel Measurements tab to enable the Spectrum Analyzer to compute and display the occupied bandwidth and adjacent channel power ratio. For more information, see Channel Measurements.