groupcounts - Number of group elements - MATLAB (original) (raw)
Syntax
Description
Table Data
[G](#mw%5Fa53a0207-64c9-4b1d-a8bf-e062ad6e642a) = groupcounts([T](#mw%5F2e7b9d0d-12fd-4766-9b0f-e0f69411cdf1),[groupvars](#mw%5F1acfce51-1b7a-40b0-b7b8-a1f25f712ad8)) returns the unique grouping variable combinations for table or timetableT, the number of members in each group, and the percentage of the data each group represents in the range [0, 100]. Groups are defined by rows in the variables in groupvars that have the same unique combination of values. Each row of the output table corresponds to one group. For example, G = groupcounts(T,"HealthStatus") returns a table with the count and percentage of each group in the variable HealthStatus.
For more information, see Group Counts Computation.
[G](#mw%5Fa53a0207-64c9-4b1d-a8bf-e062ad6e642a) = groupcounts([T](#mw%5F2e7b9d0d-12fd-4766-9b0f-e0f69411cdf1),[groupvars](#mw%5F1acfce51-1b7a-40b0-b7b8-a1f25f712ad8),[groupbins](#mw%5F4839466e-8673-43e1-8619-2eb1969d876a)) specifies to bin rows in groupvars according to binning schemegroupbins prior to grouping. For example, G = groupcounts(T,"SaleDate","year") returns the group counts and group percentages for all sales in T within each year according to the grouping variable SaleDate.
[G](#mw%5Fa53a0207-64c9-4b1d-a8bf-e062ad6e642a) = groupcounts(___,[Name,Value](#namevaluepairarguments)) specifies additional grouping properties using one or more name-value arguments for any of the previous syntaxes. For example, G = groupcounts(T,"Category1","IncludeMissingGroups",false) excludes the group made from missing data of type categorical indicated by<undefined> in Category1.
Array Data
[B](#mw%5F55755625-ef20-492d-a8dc-3e0b132e9bf1) = groupcounts([A](#mw%5F1045bb6e-dd39-4632-8e48-aea5a63e6d70)) returns the number of members in each group in vector, matrix, or cell arrayA. Groups are defined by rows in the column vectors inA that have the same unique combination of values. Each row ofB contains the count for one group.
[B](#mw%5F55755625-ef20-492d-a8dc-3e0b132e9bf1) = groupcounts([A](#mw%5F1045bb6e-dd39-4632-8e48-aea5a63e6d70),[groupbins](#mw%5F4839466e-8673-43e1-8619-2eb1969d876a)) specifies to bin the data according to binning scheme groupbins prior to grouping.
[B](#mw%5F55755625-ef20-492d-a8dc-3e0b132e9bf1) = groupcounts(___,[Name,Value](#namevaluepairarguments)) specifies additional grouping properties using one or more name-value arguments for either of the previous syntaxes for an input array.
[[B](#mw%5F55755625-ef20-492d-a8dc-3e0b132e9bf1),[BG](#mw%5F92fbcf5a-2ab5-45d0-ac09-68c1986c269f),[BP](#mw%5F295de625-10de-458f-a4c0-d47e0870097c)] = groupcounts([A](#mw%5F1045bb6e-dd39-4632-8e48-aea5a63e6d70),___) returns additional group information. BG is the unique grouping vector combinations corresponding to the rows in B. BP is the percentage of the data each group count in B represents. The percentages are in the range [0, 100].
Examples
Group Table Variables
Compute the number of elements in each group based on table data.
Create a table T that contains information about eight individuals.
HealthStatus = categorical(["Poor"; "Good"; "Fair"; "Fair"; "Poor"; "Excellent"; "Good"; "Excellent"]); Smoker = logical([1; 0; 0; 1; 1; 0; 0; 1]); Weight = [176; 153; 131; 133; 119; 120; 140; 129]; T = table(HealthStatus,Smoker,Weight)
T=8×3 table HealthStatus Smoker Weight ____________ ______ ______
 Poor           true       176
 Good           false      153
 Fair           false      131
 Fair           true       133
 Poor           true       119
 Excellent      false      120
 Good           false      140
 Excellent      true       129
Group the individuals by health status, and return the number of and percentage of individuals in each group.
G1 = groupcounts(T,"HealthStatus")
G1=4×3 table HealthStatus GroupCount Percent ____________ __________ _______
 Excellent          2           25
 Fair               2           25
 Good               2           25
 Poor               2           25
Group the individuals by health status and smoker status, and return the number of and percentage of individuals in each group. By default, groupcounts suppresses groups with zero elements, so some unique combinations of the grouping variable values are not returned.
G2 = groupcounts(T,["HealthStatus","Smoker"])
G2=6×4 table HealthStatus Smoker GroupCount Percent ____________ ______ __________ _______
 Excellent      false         1          12.5
 Excellent      true          1          12.5
 Fair           false         1          12.5
 Fair           true          1          12.5
 Good           false         2            25
 Poor           true          2            25
To return a row for each group, including those with zero elements, specify IncludeEmptyGroups as true.
G3 = groupcounts(T,["HealthStatus","Smoker"],"IncludeEmptyGroups",true)
G3=8×4 table HealthStatus Smoker GroupCount Percent ____________ ______ __________ _______
 Excellent      false         1          12.5
 Excellent      true          1          12.5
 Fair           false         1          12.5
 Fair           true          1          12.5
 Good           false         2            25
 Good           true          0             0
 Poor           false         0             0
 Poor           true          2            25
Specify Group Bins
Group data according to specified bins.
Create a timetable containing sales information for days within a single month.
TimeStamps = datetime([2017 3 4; 2017 3 2; 2017 3 15; 2017 3 10; ... 2017 3 14; 2017 3 31; 2017 3 25; ... 2017 3 29; 2017 3 21; 2017 3 18]); Profit = [2032 3071 1185 2587 1998 2899 3112 909 2619 3085]'; ItemsSold = [14 13 8 5 10 16 8 6 7 11]'; TT = timetable(TimeStamps,Profit,ItemsSold)
TT=10×2 timetable TimeStamps Profit ItemsSold ___________ ______ _________
04-Mar-2017     2032        14
02-Mar-2017     3071        13
15-Mar-2017     1185         8
10-Mar-2017     2587         5
14-Mar-2017     1998        10
31-Mar-2017     2899        16
25-Mar-2017     3112         8
29-Mar-2017      909         6
21-Mar-2017     2619         7
18-Mar-2017     3085        11
Compute the group counts by the total items sold, binning the groups into intervals of item numbers.
G = groupcounts(TT,"ItemsSold",[0 4 8 12 16])
G=3×3 table disc_ItemsSold GroupCount Percent ______________ __________ _______
   [4, 8)             3           30
   [8, 12)            4           40
   [12, 16]           3           30
Compute the group counts binned by day of the week.
G = groupcounts(TT,"TimeStamps","dayname")
G=5×3 table dayname_TimeStamps GroupCount Percent __________________ __________ _______
    Tuesday               2           20
    Wednesday             2           20
    Thursday              1           10
    Friday                2           20
    Saturday              3           30
Find Duplicate Array Elements
Determine which elements in a vector appear more than once.
Create a column vector with values between 1 and 5.
A = [1 1 2 2 3 5 3 3 1 4]';
Determine the unique groups in the vector and count the group members.
Determine which elements in the vector appear more than once by creating a logical index for the groups with a count larger than 1. Index into the groups to return the vector elements that are duplicated.
Multiple Grouping Vectors for Vector Input
Compute the group counts for a set of people grouped by their health status and smoker status.
Store information about eight individuals as three vectors of different types.
HealthStatus = categorical(["Poor"; "Good"; "Fair"; "Fair"; "Poor"; "Excellent"; "Good"; "Excellent"]); Smoker = logical([1; 0; 0; 1; 1; 0; 0; 1]); Weight = [176; 153; 131; 133; 119; 120; 140; 129];
Grouping by health status and smoker status, compute the group counts. Specify three outputs to also return the groups BG and group count percentages BP.
BG is a cell array containing two vectors that describe the groups as you look at their elements row-wise. For instance, the first row of BG{1} indicates that the individuals in the first group have a health status Excellent, and the first row of BG{2} indicates that they are nonsmokers. Finally, BP contains the percentage of members in each group for the corresponding groups in BG.
[B,BG,BP] = groupcounts({HealthStatus,Smoker},"IncludeEmptyGroups",true); B
ans = 8x1 categorical Excellent Excellent Fair Fair Good Good Poor Poor
ans = 8x1 logical array
0 1 0 1 0 1 0 1
BP = 8×1
12.5000 12.5000 12.5000 12.5000 25.0000 0 0 25.0000
Input Arguments
T — Input table
table | timetable
Input table, specified as a table or timetable.
A — Input array
column vector | matrix | cell array
Input array, specified as a column vector, group of column vectors stored as a matrix, or cell array of column vectors, character row vectors, or matrices.
groupvars — Grouping variables or vectors
scalar | vector | matrix | cell array | pattern | function handle | table vartype subscript
Grouping variables or vectors, specified as one of the options in this table. For table or timetable input data, groupvars indicates which variables to use to compute groups in the data. Other variables not specified bygroupvars are not operated on and do not pass through to the output.
| Indexing Scheme | Values to Specify | Examples |
|---|---|---|
| Variable names | A string scalar or character vectorA string array or cell array of character vectorsA pattern object | "A" or 'A' — A variable named A["A" "B"] or {'A','B'} — Two variables named A andB"Var"+digitsPattern(1) — Variables named"Var" followed by a single digit |
| Variable index | An index number that refers to the location of a variable in the tableA vector of numbersA logical vector. Typically, this vector is the same length as the number of variables, but you can omit trailing0 (false) values. | 3 — The third variable from the table[2 3] — The second and third variables from the table[false false true] — The third variable |
| Function handle | A function handle that takes a table variable as input and returns a logical scalar | @isnumeric — All the variables containing numeric values |
| Variable type | A vartype subscript that selects variables of a specified type | vartype("numeric") — All the variables containing numeric values |
Example: groupcounts(T,"Var3")
groupbins — Binning scheme for grouping variables or vectors
"none" (default) | vector of bin edges | number of bins | length of time (bin width) | name of time unit (bin width) | cell array of binning methods
Binning scheme for grouping variables or vectors, specified as one or more of the following binning methods. Grouping variables or vectors and binning scheme arguments must be the same size, or one of them can be scalar.
"none"— No binning.- Vector of bin edges — The bin edges define the bins. You can specify the edges as numeric values or as
datetimevalues fordatetimegrouping variables or vectors. - Number of bins — The number determines how many equally spaced bins to create. You can specify the number of bins as a positive integer scalar.
- Length of time (bin width) — The length of time determines the width of each bin. You can specify the bin width as a
durationorcalendarDurationscalar fordatetimeordurationgrouping variables or vectors. - Name of time unit (bin width) — The name of the time unit determines the width of each bin. You can specify the bin width as one of the options in this table for
datetimeordurationgrouping variables or vectors.Value Description Data Type "second" Each bin is 1 second. datetime and duration "minute" Each bin is 1 minute. datetime and duration "hour" Each bin is 1 hour. datetime and duration "day" Each bin is 1 calendar day. This value accounts for daylight saving time shifts. datetime and duration "week" Each bin is 1 calendar week. datetime only "month" Each bin is 1 calendar month. datetime only "quarter" Each bin is 1 calendar quarter. datetime only "year" Each bin is 1 calendar year. This value accounts for leap days. datetime and duration "decade" Each bin is 1 decade (10 calendar years). datetime only "century" Each bin is 1 century (100 calendar years). datetime only "secondofminute" Bins are seconds from 0 to 59. datetime only "minuteofhour" Bins are minutes from 0 to 59. datetime only "hourofday" Bins are hours from 0 to 23. datetime only "dayofweek" Bins are days from 1 to 7. The first day of the week is Sunday. datetime only "dayname" Bins are full day names, such as "Sunday". datetime only "dayofmonth" Bins are days from 1 to 31. datetime only "dayofyear" Bins are days from 1 to 366. datetime only "weekofmonth" Bins are weeks from 1 to 6. datetime only "weekofyear" Bins are weeks from 1 to 54. datetime only "monthname" Bins are full month names, such as "January". datetime only "monthofyear" Bins are months from 1 to 12. datetime only "quarterofyear" Bins are quarters from 1 to 4. datetime only
Example: G = groupcounts(T,"Var1",[-Inf 0 Inf])
Example: G = groupcounts(T,["Var1" "Var2"],{"none" "year"})
Name-Value Arguments
Specify optional pairs of arguments asName1=Value1,...,NameN=ValueN, where Name is the argument name and Value is the corresponding value. Name-value arguments must appear after other arguments, but the order of the pairs does not matter.
Example: G = groupcounts(T,groupvars,groupbins,IncludedEdge="right")
Before R2021a, use commas to separate each name and value, and enclose Name in quotes.
Example: G = groupcounts(T,groupvars,groupbins,"IncludedEdge","right")
IncludedEdge — Included bin edge for binning scheme
"left" (default) | "right"
Included bin edge for binning scheme, specified as either"left" or "right", indicating which end of the bin interval is inclusive.
You can specify IncludedEdge only if you also specifygroupbins, and the value applies to all binning methods for all grouping variables or vectors.
IncludeMissingGroups — Option to treat missing values as a group
true or 1 (default) | false or 0
Option to treat missing values as a group, specified as a numeric or logical1 (true) or 0 (false). If IncludeMissingGroups istrue, then groupcounts treats missing values, such as NaN, in a grouping variable or vector as a group. If a grouping variable or vector has no missing values, or ifIncludeMissingGroups is false, thengroupcounts does not treat missing values as a group.
IncludeEmptyGroups — Option to include empty groups in group counts operation
false or 0 (default) | true or 1
Option to include empty groups in the group counts operation, specified as a numeric or logical 0 (false) or1 (true). IfIncludeEmptyGroups is false, thengroupcounts omits empty groups. IfIncludeEmptyGroups is true, thengroupcounts includes empty groups.
An empty group occurs in these cases:
- A possible value of a grouping variable or vector is not represented in the input data, such as in a categorical, logical, or binned numeric variable or vector. For example, if no row in the input table has a value of
truefor a logical grouping variable, thentruedefines an empty group. - A unique combination of grouping variables or vectors is not represented in the input data. For example, if there is no row in the input table where the value of grouping variable
AisA1and the value of grouping variableBisB1, thenA1_B1defines an empty group.
Output Arguments
G — Output table
table
Output table for table or timetable input data, returned as a table.G contains the computed groups, number of elements in each group, and percentages represented by each group count. For a single grouping variable, the output groups are sorted according to the order returned by the unique function with the "sorted" option.
B — Group counts
column vector
Group counts for array input data, returned as a column vector. B contains the number of elements in each group.
BG — Groups
column vector | cell array of column vectors
Groups for array input data, returned as a column vector or cell array of column vectors. For a single grouping vector, the output groups are sorted according to the order returned by the unique function with the"sorted" option.
For more than one input vector, BG is a cell array containing column vectors of equal length. Information for each group is contained in the elements of a row across all vectors in BG. Each group maps to the corresponding row of the output array B.
BP — Group count percentages
column vector
Group count percentages for array input data, returned as a column vector.BP contains a percentage in the range [0, 100] for each group in B.
More About
Group Counts Computation
This table illustrates group counts computations.
| Sample Table T | Syntax Example | Resulting Table |
|---|---|---|
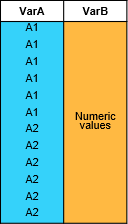 |
groupcounts(T,"VarA") | 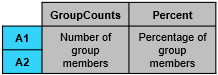 |
| groupcounts(T,["VarA" "VarB"],{"none",[-Inf 0 Inf]}) | 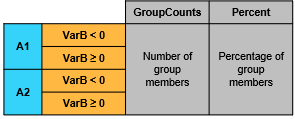 |
Tips
- When making many calls to
groupcounts, consider converting grouping variables to typecategoricalorlogicalwhen possible for improved performance. For example, if you have a string array grouping variable (such asHealthStatuswith elements"Poor","Fair","Good", and"Excellent"), you can convert it to a categorical variable using the commandcategorical(HealthStatus).
Extended Capabilities
Tall Arrays
Calculate with arrays that have more rows than fit in memory.
Thegroupcounts function supports tall arrays with the following usage notes and limitations:
- The first input argument does not support cell arrays.
- The
groupvarsargument does not support function handles. - The
IncludeEmptyGroupsname-value argument is not supported. - The order of the groups might be different compared to in-memory
groupcountscalculations. - When grouping by discretized datetime arrays, the categorical group names are different compared to in-memory
groupcountscalculations.
For more information, see Tall Arrays.
C/C++ Code Generation
Generate C and C++ code using MATLAB® Coder™.
Usage notes and limitations:
- All input arguments except for the input data must be constant.
- Sparse inputs are not supported.
- Binning scheme is not supported for datetime or duration data.
- If the number of group variables can change at runtime, the second output
BGis a cell array.
Thread-Based Environment
Run code in the background using MATLAB® backgroundPool or accelerate code with Parallel Computing Toolbox™ ThreadPool.
This function fully supports thread-based environments. For more information, see Run MATLAB Functions in Thread-Based Environment.
Version History
Introduced in R2019a
R2024a: Apply multiple binning methods to grouping variable
Apply multiple binning methods to one grouping variable or vector by specifying a cell array of binning methods.
R2022a: Code generation support
Generate C or C++ code for the groupcounts function. For usage notes and limitations, see C/C++ Code Generation.
R2021a: Percentages automatically included in table outputs
When groupcounts operates on data in a table or timetable, the output contains an additional table variable for the percentages. The percentages are in the range [0, 100] and are included in the table variablePercent.
Any code that references specific table variables is unaffected. However, you might need to update code that depends on the number of variables in the output table.