Smooth Data - Smooth noisy data in the Live Editor - MATLAB (original) (raw)
Main Content
Smooth noisy data in the Live Editor
Description
The Smooth Data task lets you interactively smooth noisy data. The task automatically generates MATLAB® code for your live script.
Using this task, you can:
- Customize the method for smoothing data in a workspace variable.
- Adjust parameters to generate less or more smoothing.
- Visualize the input data compared to the smoothed data.
More
Related Functions
Smooth Data generates code that uses the smoothdata function.
Open the Task
To add the Smooth Data task to a live script in the MATLAB Editor:
- On the Live Editor tab, select > .
- In a code block in the script, type a relevant keyword, such as
smooth,noisy,movmedian, orlowess. SelectSmooth Datafrom the suggested command completions. For some keywords, the task automatically updates one or more corresponding parameters.
Examples
Increase Smoothing to Reduce Noise
Interactively increase smoothing to reduce noise by adjusting the smoothing factor using the Smooth Data task in the Live Editor.
First, create a vector of noisy data.
x = 1:100; rng(0,"twister") data = cos(2pi0.05x+2pirand) + 0.5randn(1,100);
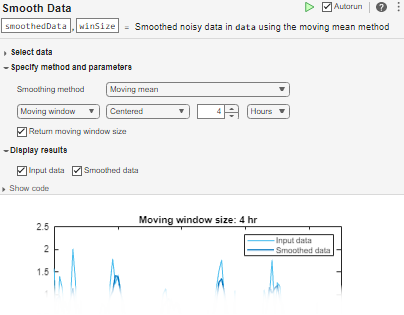
Open the Smooth Data task in the Live Editor. To smooth the noisy data, select data as the input data. Because the sample points are the same as the default vector of _x_-axis locations, you do not need to specify x in the X-axis field.
Smooth the vector with a Gaussian-weighted moving average filter by selecting the Gaussian filter method in the Smoothing method field. The title of the plot indicates that the smoothing window has length 4. Alternatively, you can select Return moving window size to return the window size in addition to the smoothed data.
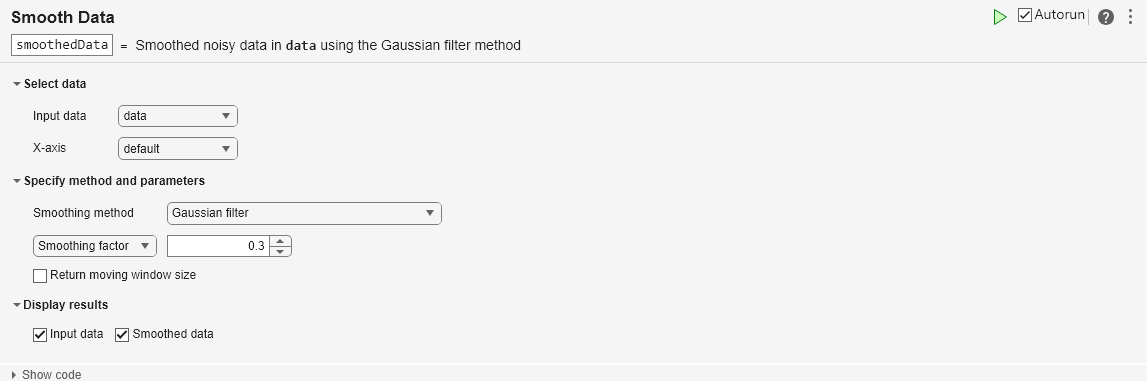
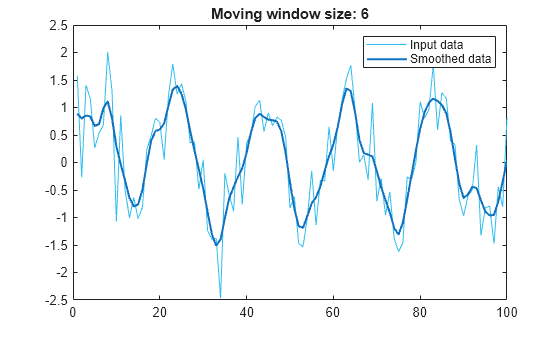
Smooth using a larger window size, resulting in more smoothing, by increasing the smoothing factor from the default value of 0.25 to 0.3. The title of the plot updates to indicate that the smoothing window has length 6.
Related Examples
Parameters
Input data — Valid input data from workspace
vector | table | timetable
This task operates on input data contained in a vector, table, or timetable. The data can be of type single, double,logical, or signed or unsigned integer types such asint64.
For table or timetable input data, to smooth all variables with a supported type, select All supported variables. To smooth all variables of type single or double, or signed or unsigned integer types, select All numeric variables. To choose which supported variables to smooth, select Specified variables.
Smoothing method — Method for smoothing data
Moving mean | Moving median | Gaussian filter | ...
Specify the smoothing method as one of these options, which operate over local windows of data.
| Method | Description |
|---|---|
| Moving mean | Moving average. This method is useful for reducing periodic trends in data. |
| Moving median | Moving median. This method is useful for reducing periodic trends in data when outliers are present. |
| Gaussian filter | Gaussian-weighted moving average. |
| Local linear regression (Lowess) | Lowess linear regression. This method can be computationally expensive, but it results in fewer discontinuities. |
| Local quadratic regression (Loess) | Loess quadratic regression. This method is slightly more computationally expensive than local linear regression. |
| Robust Lowess | Robust Lowess linear regression. This method is a more computationally expensive version of local linear regression, but it is more robust to outliers. |
| Robust Loess | Robust Loess quadratic regression. This method is a more computationally expensive version of local quadratic regression, but it is more robust to outliers. |
| Savitzky-Golay polynomial filter | Savitzky-Golay polynomial filter, which smooths according to a polynomial of specified degree, and is fitted over each window. This method can be more effective than other methods when the data varies rapidly. |
Moving window — Window for smoothing methods
Centered (default) | Asymmetric
Specify the window type and size for the smoothing method instead of specifying a general smoothing factor. If you do not specify the moving window type and size, then the window size is heuristically determined.
| Window | Description |
|---|---|
| Centered | Specified window length centered about the current point |
| Asymmetric | Specified window containing the number of elements before the current point and the number of elements after the current point |
Window sizes are relative to the X-axis variable units.
Limitations
The Smooth Data task does not support 2-D smoothing windows.
Version History
Introduced in R2019b
R2024a: Return moving window size
Return the size of the moving window used with the smoothing method. If you specify the moving window size, the returned window size matches the input value. If you do not specify the moving window size, then the returned window size is heuristically determined based on the input data. If the moving window is asymmetric, then the returned window is a two-element vector of nonnegative integers [b f], where the window contains the current element, b elements backward, andf elements forward.
R2022b: Plot multiple table variables
Simultaneously plot multiple table variables in the display of this Live Editor task. For table or timetable data, to visualize all selected table variables at once in a tiled chart layout, set the field.
R2022b: Append smoothed table variables
Append input table variables with table variables containing smoothed data. For table or timetable input data, to append the smoothed data, set the field.
R2022a: Live Editor task does not run automatically if inputs have more than 1 million elements
This Live Editor task does not run automatically if the inputs have more than 1 million elements. In previous releases, the task always ran automatically for inputs of any size. If the inputs have a large number of elements, then the code generated by this task can take a noticeable amount of time to run (more than a few seconds).
When a task does not run automatically, the Autorun indicator is disabled. You can either run the task manually when needed or choose to enable the task to run automatically.
R2021a: Operate on multiple table variables
This Live Editor task can operate on multiple table variables at the same time. For table or timetable input data, to operate on multiple variables, select All supported variables or Specified variables. Return all of the variables or only the modified variables, and specify which variable to visualize.