mpiprofile - Profile parallel communication and execution times - MATLAB (original) (raw)
Profile parallel communication and execution times
Syntax
mpiprofile mpiprofile on <options> mpiprofile off mpiprofile reset mpiprofile viewer mpiprofile resume mpiprofile clear mpiprofile status stats = mpiprofile('info') mpiprofile('viewer',stats)
Description
mpiprofile enables or disables the parallel profiler data collection on a MATLAB® worker running in a parallel pool. You can use mpiprofile either from the MATLAB client or directly from the worker from within an spmd block. When you run mpiprofile from the MATLAB client, mpiprofile performs the action on the MATLAB workers.
mpiprofile aggregates statistics on execution time and communication times. mpiprofile collects statistics in a manner similar to running the profile command on each MATLAB worker. By default, the parallel profiling extensions include array fields that collect information on communication with each of the other workers.
mpiprofile on <options> starts the parallel profiler and clears previously recorded profile statistics.
mpiprofile takes the following options.
| Option | Description |
|---|---|
| -messagedetail default-messagedetail simplified-messagedetail off | This option specifies the detail at which communication information is stored. -messagedetail default collects information on a per-worker instance. -messagedetail simplified turns off collection for *PerLab data fields, which reduces the profiling overhead. If you have a very large cluster, you might want to use this option; however, you will not get all the detailed inter-worker communication plots in the viewer.Note that changing -messagedetail will clear any previously stored data.For information about the structure of returned data, see mpiprofile info below. |
| -history-nohistory-historysize | mpiprofile supports these options in the same way as the standard profile.No other profile options are supported by mpiprofile. These three options have no effect on the data displayed by mpiprofile viewer. |
mpiprofile off stops the parallel profiler. To reset the state of the profiler and disable collecting communication information, use mpiprofile reset.
mpiprofile reset turns off the parallel profiler and resets the data collection back to the standard profiler. If you do not call reset, subsequent profile commands will collect MPI information.
mpiprofile viewer stops the profiler and opens the graphical profile browser with parallel options. The output is an HTML report displayed in the profiler window. The file listing at the bottom of the function profile page shows several columns to the left of each line of code. In the summary page:
- Column 1 indicates the number of calls to that line.
- Column 2 indicates total time spent on the line in seconds.
- Columns 3–6 contain the communication information specific to the parallel profiler.
mpiprofile resume restarts the profiler without clearing previously recorded function statistics.
mpiprofile clear clears the profile information.
mpiprofile status returns the status of the parallel profiler.
stats = mpiprofile('info') stops the parallel profiler and returns a structure containing the profiler statistics. stats contains the same fields as returned by profile('info'), with the following additional fields in the FunctionTable entry. All these fields are recorded on a per-function and per-line basis, except for the *PerLab fields.
| Field | Description |
|---|---|
| BytesSent | Records the quantity of data sent |
| BytesReceived | Records the quantity of data received |
| TimeWasted | Records communication waiting time |
| CommTime | Records the communication time |
| CommTimePerLab | Vector of communication receive time for each worker |
| TimeWastedPerLab | Vector of communication waiting time for each worker |
| BytesReceivedPerLab | Vector of data received from each worker |
The three *PerLab fields are collected only on a per-function basis, and you can turn them off by typing the following command:
mpiprofile on -messagedetail simplified
When you run it from the MATLAB client, stats = mpiprofile('info') returns information from all workers. When you run it on a worker, mpiprofile('info') returns the profile information specific to that worker.
mpiprofile('viewer',stats) opens the graphical profile browser showing the profiling information contained in stats. You can use stats = mpiprofile('info') on the client to create the structure array.
mpiprofile does not accept -timer clock options, because the communication timer clock must be real.
For more information and examples on using the parallel profiler, see Profiling Parallel Code.
Examples
Profile Parallel Code
Turn on the profiler. With default preferences, turning on the profiler will create a parallel pool automatically if there is not one already created.
Run your parallel code.
A = rand(1000,'distributed'); b = sum(A, 2); x = A\b;
Show the collected profile information.
Analyze Parallel Profiler Data
The parallel profiler collects information about the execution of code on each worker and the communications between the workers. After you profile your parallel code with mpiprofile, start the graphical viewer by calling mpiprofile viewer.
R = rand(1e3,'distributed'); mpiprofile on R = R*R; mpiprofile viewer
The viewer has three types of pages or views.
The parallel profile viewer, opens with the Function Summary Report first, in the same way as the standard profiler. In this view you can see profile information from any single lab or from multiple labs simultaneously. It initially shows all functions executed on lab 1. You can then choose via the listbox options to see profiling information from any lab.
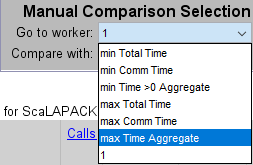
In this view you can see Aggregate information using the Manual Comparison Selection listboxes. When you select an Aggregate in this view, the profiler accumulates and displays the specified data about all of the executed functions. For example,
- max Time Aggregate lists every function called in the program, and for each function, the data from the lab that spent the most time executing it.
- min Time >0 Aggregate lists every function called in the program, and for each function, the statistics from the lab that spent the least time executing it.
Here are a few things to keep in mind in this view:
- To re-sort the table by a different field simply click the related column title (e.g. Total Comm Time).
- To select a function and go to the Function Detail Report, click any function name that appears in the Function Name column.
- To compare profiling information from different labs, use the Comparison listboxes and buttons (found in the top of each page). Comparison information always displays in a maroon color font.
- To find which lab the main profiling data (black or blue text) comes from, look at the orange highlighted text at the top of the displayed page or in the top toolbar.
The Function Detail Report displays information on the individual lines executed inside the current function for each lab. This includes a Busy Lines table which can be used to compare the top five lines of code on different labs. This report is only fully functional if the profiled MATLAB files are available on the client MATLAB path.
The Function Detail Report is different from the Function Summary Report in several ways:
- The report is generated for one function at a time. The function name is displayed at the top of the page, in green or orange. Green highlighting indicates that the function spent very little (or no) time in communication. Orange highlighting indicates more than 20% of the time was spent in communication or waiting for communication.
- Every listbox option takes into account the last function you clicked. The current function can be changed, if need be, by clicking the Home button in the top toolbar, which also takes you back to the Function Summary Report.
- Profile information Aggregates from multiple labs are calculated only on a per function basis. Therefore in the Function Detail Report, selecting max Time Aggregate displays information from the one lab that took longest executing the current function.
- Comparisons of profiling information are only available in the top five lines shown in the Busy Lines table (the first table from the top unless there is a parents table).
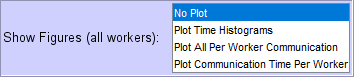
The Plot View is shown whenever you click a plot option in the Show Figures listbox. The plots show communication and timing information from all the labs for the given function. There are two types of plots (Histograms and Per Worker Images). The Plot Time Histograms and Plot All Per Worker Communication options show three figures using the corresponding communication fields returned by the mpiprofile info command.
Plot Time Histograms shows histograms for Total Time, Total Communication Time, and Communication Waiting Time.
Plot All Per Worker Communication shows 2D color coded image plots for Data Received, Receive Communication Time, and Communication Waiting Time.
The Plot Communication Time Per Worker option in the Show Figures listbox shows only the Receive Communication Time chart and therefore is faster to generate.
Plotting Per Function or Per Session
There are two modes for the plots:
- Overall session plots: If you are in the Function Summary Report and you have not selected any function the plots are generated for all code executed (with the profiler on).
- Per function plots : If you are in the Function Detail Report after having selected a function, clicking any of the available plots (in the listbox shown below) will take you to the function specific Plot View.
You can always tell which plot mode you are using by looking at the titles of each figure. The titles show the name of the current function (or all functions when showing data for the entire session). The titles also include the name of the profiling field being displayed (e.g., Communication Time, Total Time). If you want to see the data for the entire profiling session after having selected a specific function, click Home to go back to the Function Summary Report then select your desired plot (using the listbox shown below).
Version History
Introduced in R2007b